

This analysis covers the 2024 global market size, decade-long growth trajectory, who dominates the industry, what profitability looks like heading into 2026, and — critically — how independent and franchise auto dealers can apply these same principles directly to their F&I operations.
TLDR: Key Takeaways
- Global reinsurance premiums reached $394.7 billion in 2024, up 84% since 2015, outpacing direct insurance growth of 70%
- Non-life (property and casualty) reinsurance dominates at 74% of total market premiums
- The industry averaged a 15.7% ROE in 2024, well above its cost of capital
- Top 10 reinsurers control 59% of global premiums — Munich Re leads with a 10% non-life share
- Auto dealers can capture these same underwriting profits and investment returns through dealer-owned reinsurance programs
What Is Reinsurance and Why Does It Matter in 2026
Reinsurance is, at its simplest, insurance for insurance companies. A primary insurer — the company that sells your auto policy or home coverage — transfers a portion of its risk to a reinsurer in exchange for a premium. When covered losses occur, the reinsurer pays its agreed share. This arrangement lets primary carriers write more business, stabilize their loss ratios, and avoid catastrophic exposure from any single event or class of risk.
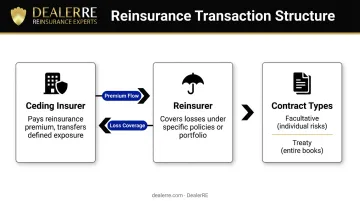
Three parties define every reinsurance transaction:
- Ceding insurer pays a reinsurance premium to transfer defined exposure
- Reinsurer agrees to cover losses under specific policies or a portfolio
- Contracts can cover individual large risks (facultative) or entire books of business (treaty)
The global reach of this market matters directly to U.S. operations: foreign reinsurers held 60.5% of U.S. direct reinsurance business as of 2020, up from 44.3% in 1999. Decisions made in Munich, Zurich, and London shape the pricing and terms available to domestic carriers.
For auto dealers and F&I program administrators, that trickle-down effect is tangible. When global reinsurance capacity tightens or treaty terms harden, the cost of backing F&I products — vehicle service contracts, GAP, ancillary coverage — rises at the carrier level. Dealers who operate their own reinsurance structures have more insulation from those market swings than those relying on third-party providers absorbing the same pressures.
Global Reinsurance Market Size and Growth (2024–2026)
The Headline Numbers
Global reinsurance gross written premiums totaled $394.694 billion in 2024, based on data from 154 reinsurers across all major regions, per Atlas Magazine's December 2025 renewal report. That figure breaks down as:
- Non-life (property and casualty): $293.2 billion — 74% of total
- Life reinsurance: $101.5 billion — 26% of total
Non-life growth is driven by demand for property catastrophe coverage, rising insured asset values, and sharply higher vehicle repair and replacement costs. Life reinsurance growth reflects U.S. annuity market expansion and the improved economics of mortality risk at higher interest rates.
A Decade of Outperformance
Reinsurance premiums grew 84% from 2015 to 2024 — versus 70% for direct insurance over the same period. The reinsurance industry's share of direct premiums also expanded, from 4.7% in 2015 to 5.1% in 2024. Three structural drivers explain this:
- Rising insured values across property, vehicles, and infrastructure
- Natural catastrophe frequency and severity, pushing primary carriers to buy more protection
- Emerging market demand as Asia, the Middle East, and Africa deepen their insurance penetration
Capital Position and 2026 Outlook
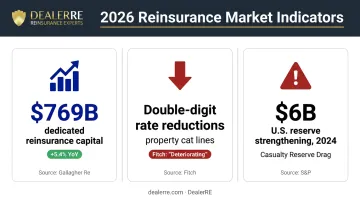
Global reinsurance dedicated capital reached $769 billion at year-end 2024, up 5.4% year-over-year per Gallagher Re data — signaling strong investor confidence in the sector's returns.
That capital strength, however, is now working against pricing. Record supply has shifted negotiating leverage toward cedants, and 2026 is showing the effects:
- Fitch Ratings maintains a "deteriorating" sector outlook for 2026, pointing to capital abundance as the primary pressure
- January 1, 2026 renewals delivered double-digit risk-adjusted rate reductions in property catastrophe lines
- S&P Global projects stable overall performance but flags U.S. casualty reserve strengthening — roughly $6 billion in 2024 — as a persistent drag from social inflation and nuclear verdicts
Market Concentration: Who Dominates Global Reinsurance
The Concentration Picture
The top 5 reinsurers globally held approximately 40% of total premiums in 2024, while the top 10 controlled 59%. Concentration has actually declined from its peak — the top five held roughly 55% in 2017 — as new capital entrants and alternative vehicles like catastrophe bonds have diversified the capacity base.
The Leading Players
| Company | Headquarters | Notable Position |
|---|---|---|
| Munich Re | Munich, Germany | Largest non-life reinsurer; $29.4B premiums, 10% market share |
| Swiss Re | Zurich, Switzerland | World's largest overall reinsurer (S&P ranking) |
| Hannover Re | Hannover, Germany | Top 3 globally by premium volume |
| Berkshire Hathaway / General Re | Omaha, USA | Largest by shareholders' equity (Americas domination) |
| SCOR | Paris, France | Top 5 globally |
| Lloyd's of London | London, UK | #2 non-life reinsurer globally |
Six of the top ten non-life reinsurers are European-headquartered — a reflection of Europe's century-long dominance of the sector. Munich Re has held the #1 non-life position every year since 2010, with only 2017 as the exception. That consistency at the top contrasts sharply with the broader market, where concentration has been loosening steadily.
What Declining Concentration Means
Despite the dominance of large players, smaller and specialized reinsurers compete effectively in niche segments precisely because underwriting skill and risk selection matter more than scale in many lines. This structural reality — where expertise outweighs size — explains why specialty reinsurance segments, including dealer-owned program structures in the automotive F&I market, have grown alongside the traditional carrier hierarchy rather than being crowded out by it.
Financial Performance: Profitability, ROE, and Combined Ratios
Underwriting Profitability
The global combined ratio — losses plus expenses divided by premiums earned — came in at 91.3% in 2024, slightly up from 90.3% in 2023 but firmly below the 100% threshold that defines underwriting profitability. A combined ratio below 100% means the industry is earning more in premiums than it pays in losses and expenses, before investment income.
The distance covered since 2017 is significant: that year's combined ratio was 110.3%; in 2020, it hit 104.5%. The recovery to sub-93% reflects a multi-year cycle of rate increases, higher deductibles, and stricter risk selection.
2025–2026 combined ratio outlook:
- Q1 2025: 98.7% — spiked by California wildfire losses (Aon estimate)
- Full-year 2025: 94–96% (S&P Global projection)
- Full-year 2026: 95–98% (S&P Global projection)
Net Income and ROE
Global reinsurer net income grew approximately 12% year-over-year in 2024, reaching $85.7 billion. That compares to an industry-wide nadir in 2022, when the combined ratio hit 95.6% and ROE dropped to just 2.17%.
The ROE recovery tells that story directly:
| Year | Global Reinsurer ROE |
|---|---|
| 2022 | 2.17% |
| 2023 | 21.4% |
| 2024 | 15.7% |
| 2026 (projected) | ~16.1% |
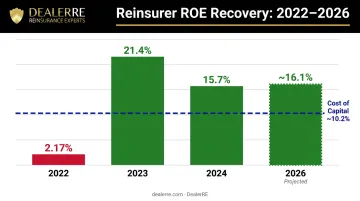
At 15.7%, the 2024 return on equity exceeded the industry's estimated cost of capital by roughly 5–6 percentage points: that spread is the practical measure of genuine value creation for shareholders. Guy Carpenter projects the cost of equity declining from 10.2% in 2024 to 8.4% by 2027, meaning the spread stays positive even as returns normalize.
Balance Sheet Strength
Those ROE gains have compounded directly into capital reserves. Global reinsurers' shareholders' equity reached $1.177 trillion in 2024, up 11% year-over-year and up 91% from 2015. Retained profits, higher investment income on fixed-income portfolios, and disciplined underwriting drove that accumulation — giving the industry sufficient buffer to absorb major catastrophe losses without triggering solvency concerns.
Regional Reinsurance Trends Heading into 2026
Americas: Capital-Heavy, Catastrophe-Exposed
Americas-based reinsurers (anchored by Berkshire Hathaway / National Indemnity) held 74.7% of global shareholders' equity in 2024 while contributing approximately 42.9% of net income. The equity-to-income ratio mismatch reflects Berkshire's enormous capital base relative to its reinsurance activity.
The U.S. market faces elevated natural catastrophe exposure , particularly from hurricanes and wildfires, which drove January 2026 renewal negotiations toward stricter terms and tighter attachment points even as property cat rates softened overall.
Fastest-Growing Regions
The most dynamic growth is occurring outside mature markets:
- Middle Eastern reinsurers: Net income grew 75% between 2023 and 2024
- Asian reinsurers: Net income grew 67% over the same period
- Europe: Net income declined approximately 1%, reflecting competitive pressure and reserve development
Africa and the Middle East together represent less than 1% of global reinsurance equity but are expanding faster than any other region — a signal of long-term diversification in global capacity that is already beginning to reshape pricing and terms across all markets.
What This Means for U.S. Dealers
Tighter carrier terms at U.S. reinsurance renewals pass directly through to primary carriers. When reinsurers tighten pricing, those carriers respond by adjusting their own programs:
- Raising rates on F&I products sold to dealers
- Tightening coverage terms and reducing product availability
- Compressing dealer margins on third-party provider agreements
For dealers relying on outside F&I product providers, this mechanism means rising external costs with no offset. A dealer-owned reinsurance structure keeps those premiums in-house as underwriting profit instead of passing them upstream.
What Global Reinsurance Trends Mean for Auto Dealers
The Same Economics, Scaled Down
The economic logic that makes global reinsurance a nearly $400 billion industry applies directly to auto dealers who sell F&I products — vehicle service contracts, GAP, CPI, and ancillary coverages. Right now, most dealers are ceding every dollar of underwriting profit to third-party administrators, just as a primary insurer would if it never bought reinsurance.
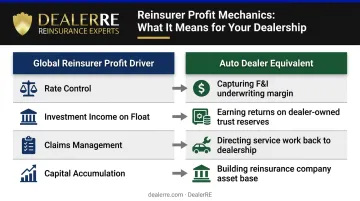
The global reinsurers that posted 15.7% ROE in 2024 did so through four mechanisms:
- Rate control — pricing risk accurately based on their own experience
- Investment income on float — earning returns on reserves held before claims are paid
- Claims management — selecting and adjudicating risk precisely
- Capital accumulation — retaining surplus earnings for reinvestment
Each of these maps to a tangible dealer benefit:
| Reinsurer Profit Driver | Dealer Equivalent |
|---|---|
| Underwriting margin | Capturing F&I product profit instead of ceding it |
| Investment income on reserves | Earning returns on premiums in dealer-owned trust |
| Claims management | Directing service work back to the dealership |
| Capital accumulation | Building a reinsurance company asset base for reinvestment |
The Admin Obligor Model Explained
A dealer-owned reinsurance company (structured as an admin obligor) flips the traditional F&I arrangement. Instead of selling a third-party warranty and watching the underwriting profit leave, the dealer's own reinsurance entity captures that margin.
The dealer continues earning the same front-end gross on each deal, while the reinsurance company accumulates the underwriting surplus. That surplus can fund real estate purchases, dealership reinvestment, or tax-advantaged capital growth under IRS Code 831(b).
The structure is backed by A-rated carriers, which means the dealer's customers have the same claim security they'd have with any major provider — the dealer simply retains what was previously flowing to a third-party administrator.
DealerRE's Role
DealerRE has helped more than 400 dealers nationwide establish and manage their own admin obligor reinsurance companies. The program covers vehicle service contracts, GAP, CPI, debt cancellation coverage, and ancillary products like tire and wheel, door ding, and windshield protection.
DealerRE handles setup, compliance, claims adjudication, legal filings, tax returns, and financial reporting, so dealers aren't managing those workflows themselves — they stay focused on running the dealership.
Dealers selling more than 30 vehicles per month typically have sufficient premium volume to make the structure work. The starting point is a dealership analysis that shows exactly what profit is currently leaving through third-party arrangements.
Frequently Asked Questions
How big is the global reinsurance market?
Global reinsurance gross written premiums totaled $394.7 billion in 2024, based on data from 154 reinsurers worldwide — an 84% increase since 2015. Growth is projected to continue through 2026, driven by natural catastrophe demand, cyber risk, and rising insured values.
What are the largest reinsurance companies in the world?
The top five by premium volume are Munich Re, Swiss Re, Hannover Re, Berkshire Hathaway / General Re, and SCOR. Munich Re leads non-life reinsurance with approximately $29.4 billion in premiums and a 10% global market share. Six of the top ten non-life reinsurers are European-headquartered.
What is the difference between life and non-life reinsurance?
Non-life reinsurance covers property damage, liability, and casualty risks — it represents 74% of the global market at approximately $293 billion. Life reinsurance covers mortality, longevity, and annuity-related risks and accounts for the remaining 26%, or roughly $101.5 billion.
What is a combined ratio and what does it tell you about reinsurance profitability?
A combined ratio below 100% means a reinsurer collects more in premiums than it pays in losses and expenses — the global market averaged a profitable 91.3% in 2024. That figure is projected to rise to 94–98% in 2025–2026 as catastrophe losses increase.
What is dealer-owned reinsurance and how does it relate to the global reinsurance industry?
Dealer-owned reinsurance follows the same profit-retention model used by global reinsurers. A dealership establishes its own reinsurance company to capture F&I underwriting profits, earn investment income on reserves, and control claims outcomes — keeping revenue that would otherwise go to a third-party administrator.
Is the global reinsurance market expected to grow in 2026?
Growth is expected to continue, driven by natural catastrophe demand, cyber risk, and rising insured values. That said, record capital supply is softening property catastrophe pricing, and Fitch holds a "deteriorating" profitability outlook for 2026. The market is projected to remain technically profitable, with combined ratios in the 95–98% range.