Introduction
Most auto dealers encounter the phrase "reinsurance risk modeling" and assume it belongs in the world of institutional insurers and actuarial departments — not the F&I office. That assumption costs them money.
When a dealership owns its own reinsurance company backing VSC, GAP, or ancillary products, it is carrying real financial risk. How that risk is measured, priced, and monitored determines whether underwriting profit flows back to the dealer or erodes over time.
F&I gross profit per vehicle retailed reached $2,505 in Q1 2025. That figure underscores how much is at stake in the finance office — and how much a poorly structured reinsurance program can leave on the table.
This article covers what reinsurance risk modeling actually is, the core techniques used, the key risk categories dealer-owned programs face, and what dealers should be doing with this knowledge to protect and grow their programs.
TL;DR
- Uses historical data and statistical methods to estimate future claims costs and manage financial exposure
- Core techniques include frequency-severity analysis, stochastic modeling, loss ratio monitoring, and scenario stress testing
- Dealer-owned programs face four primary risk categories: underwriting, credit/counterparty, operational, and market/investment risk
- Well-managed dealer VSC reinsurance programs typically target a long-term loss ratio of 50% to 65%
- Understanding these tools leads to better program decisions — no actuarial degree required
What Is Reinsurance Risk Modeling?
Risk modeling is the structured use of historical claims data, statistical analysis, and actuarial assumptions to answer three fundamental questions: How much risk am I holding? Is it priced correctly? Are my reserves sufficient?
Every risk model produces two foundational outputs:
- Claim frequency — how often claims occur per policy or exposure unit
- Claim severity — the average cost when a claim does occur
Multiply these together and you get the pure premium — the technical basis for pricing any reinsured product. If either estimate is off, the program is either overcharging customers or absorbing losses it wasn't prepared for.
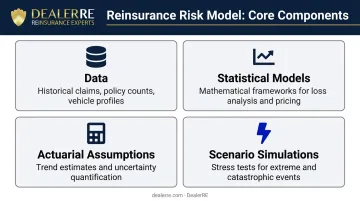
The Four Components of Any Risk Model
| Component | What It Does |
|---|---|
| Data | Historical claims, policy counts, vehicle profiles, premium volume |
| Statistical Models | Mathematical frameworks estimating future patterns |
| Actuarial Assumptions | Forward-looking estimates for trends and uncertainty |
| Scenario Simulations | Stress tests for extreme or unexpected events |
Two types of models drive dealer reinsurance programs. Quantitative models are data-driven: claims triangles, frequency-severity analysis, loss ratio tracking. Qualitative models rely on expert judgment, especially when a program has limited claims history. As CAS research notes, "qualitative input can be as important as quantitative, if not more" when data is inconsistent or insufficient to train a statistical model reliably.
That distinction matters directly for dealer reinsurance programs. For admin obligor structures, experienced administrators blend historical claims data with underwriting judgment — this is especially true during a program's early years, before enough claims history has accumulated to rely on quantitative models alone. DealerRE applies both approaches across the programs it administers.
Core Risk Modeling Techniques
Frequency-Severity Analysis
Frequency-severity analysis underlies every VSC and GAP pricing decision — and when it's wrong, reserves fall short before anyone notices.
Frequency models estimate how often claims will be filed using statistical distributions — Poisson is standard, where variance equals the mean. Severity models estimate average repair cost when a claim occurs, commonly using lognormal or Pareto distributions.
Published actuarial data from the CAS Forum shows used-vehicle VSC claim frequency at 42.5% with average severity of $311 at the insurer level. These figures shift at the dealer reinsurance layer due to program structure, ceding commissions, and the specific vehicle profiles a dealer carries.
The practical implication: if a dealer's program covers older, higher-mileage inventory without adjusting frequency assumptions, the pure premium will be understated. Claims come in higher than reserved, and underwriting profit disappears.
Stochastic Modeling and Monte Carlo Simulation
Frequency-severity analysis tells you the expected outcome. Stochastic modeling tells you everything else.
Rather than predicting one outcome, stochastic models generate thousands of randomized claim scenarios to map the full probability distribution — including the scenarios that rarely happen but cost the most when they do. This is where tail risk becomes visible.
Flat averages won't flag a sudden spike in engine claims tied to a specific model-year defect, or a wave of GAP claims during a rapid vehicle value correction. Monte Carlo simulation shows the dealer not just the expected outcome, but how severe the 5% or 1% scenarios actually are.
For dealer reinsurers, this informs three decisions:
- How much capital should remain in reserve rather than redirected into investments
- Whether current retention limits expose the program to catastrophic loss concentration
- Where stop-loss or retrocession coverage is warranted to cap downside exposure
Loss Ratio and Combined Ratio Monitoring
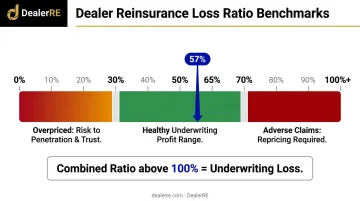
Once a program is running, the loss ratio becomes the primary diagnostic. Claims paid divided by earned premiums, it's the most direct measure of program health. For dealer-owned VSC reinsurance programs, a healthy long-term loss ratio typically runs between 50% and 65%.
Context matters in both directions:
- A ratio below 30% may indicate overpriced products eroding customer trust and penetration rates
- A ratio above 70% signals adverse claims experience requiring pricing or product mix adjustment
The combined ratio adds operating expenses (administration, claims adjudication, compliance) to the equation. A combined ratio above 100% means the program is losing money on underwriting — the trigger to reprice, tighten retention limits, or examine which product lines are generating the drag.
Scenario and Stress Testing
Deterministic stress testing simulates specific adverse events rather than random outcomes. For dealer reinsurers, two scenarios deserve regular modeling:
- Motor vehicle repair prices rose approximately 20% year-over-year as of mid-2023, driven by parts complexity, supply chain pressure, and technician shortages. VSC reserves sized on pre-inflation severity figures are inadequate if that trend continues.
- GAP claim costs surged 95% for used vehicles between 2014 and 2018 as vehicle values normalized. Dealers with high-LTV portfolios carry concentrated GAP exposure that a flat-average model won't capture.
Stress testing doesn't require an actuarial department. It requires two questions: what happens to reserve adequacy if repair costs stay elevated for 24 months, and what happens to GAP exposure if used vehicle values drop 15%? Dealers who run these numbers before a downturn are the ones who stay solvent through one.
Key Risk Categories in Dealer-Owned Programs
Underwriting Risk
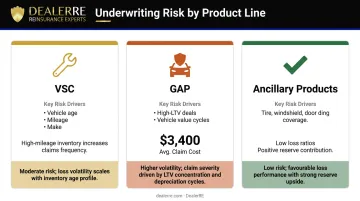
This is the primary risk in any dealer reinsurance program — the possibility that actual claims exceed what was priced and reserved. It shows up differently across product lines:
- VSC: Mechanical breakdown frequency varies significantly by vehicle age, mileage, and make. Programs covering high-mileage inventory without adjusted pricing are the most exposed.
- GAP: High-LTV deals and vehicle value cycles drive claim exposure. Average GAP claim costs have historically been around $3,400, with significant volatility.
- Ancillary products: Tire & wheel, windshield, and door ding products typically carry low loss ratios — they contribute meaningfully to program profitability and reserve accumulation.
Managing it well means disciplined pricing at the product level, setting retention limits matched to your volume, and reviewing claims data regularly to catch adverse trends before they compound.
Credit and Counterparty Risk
In admin obligor structures backed by A-rated insurers — the structure DealerRE uses — the consumer's contract is backed by the financial strength of the fronting carrier. If the dealer's reinsurance company cannot meet its obligations, the ultimate liability rests with the direct writing insurance company.
This structure materially reduces counterparty risk compared to non-backed arrangements. Credit risk can still arise through third-party administrator relationships or reinsurance layering, but A-rated backing insulates dealers from the most significant exposure.
Operational Risk
Operational risk is the loss exposure from failed internal processes. In dealer reinsurance, that includes:
- Mishandled or delayed claims adjudication
- Incorrect regulatory filings
- Administrative errors in premium accounting
- Compliance breakdowns that trigger state-level exposure
These failures inflate the loss ratio and create regulatory risk. When claims adjudication, compliance filings, and financial reporting are handled by specialists rather than internal dealership staff, the exposure shrinks considerably.
Market and Investment Risk
Dealer reinsurance companies accumulate premium reserves that are held in conservative instruments until claims obligations clear. Dealers who redirect earned reinsurance income into real estate, business reinvestment, or other vehicles take on additional market risk.
The rule is simple: reserves sized to cover projected claims stay liquid and accessible. Only confirmed surplus income — beyond what's needed for obligations — moves into outside investments.
How Risk Modeling Shapes F&I Profitability
When a dealer sells a VSC through a third-party provider, that provider runs its own risk models, sets pricing based on those models, and retains the underwriting profit. The dealer earns a front-end margin, nothing more.
When a dealer owns the reinsurance company, those underwriting profits flow back to the dealer instead. Accurate risk modeling determines how much stays. Poorly modeled risk compresses that margin: underpriced products generate insufficient premium, while overpriced products suppress penetration and customer satisfaction.
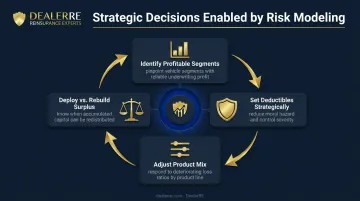
Risk modeling also enables strategic decisions that third-party arrangements don't allow:
- Identifying which vehicle segments or model years generate reliable underwriting profit vs. volatility
- Setting deductibles that reduce moral hazard and keep severity in check
- Adjusting product mix when specific lines show deteriorating loss ratios
- Knowing when accumulated surplus can be deployed vs. when reserves need to be rebuilt
Making those decisions consistently requires reliable data. DealerRE's full-service model supports this process by providing performance reports, claims adjudication, and bookkeeping — translating raw program data into information dealers can act on.
Monitoring and Managing Program Risk
Building an initial risk model is the starting point — but the ongoing monitoring discipline is what keeps programs profitable over time.
Recommended Review Cadence
Industry best practices suggest a two-layer approach:
- Monthly: Review operational metrics — loss ratios by product, claims activity, reserve levels, premium-to-reserve ratios, and emerging loss trends (30-, 60-, 90-day claims reports)
- Annual/Biennial: Actuarial review of pricing assumptions and reserve adequacy
- Triggered reviews: Any unusual claims spike, major shift in vehicle portfolio composition, or significant market disruption (such as a repair cost surge) warrants an immediate review outside the regular cadence
Programs that go unmonitored tend to accumulate reserve deficiencies quietly — problems that only become visible once claims have already developed and the gap is difficult to close.
Governance Best Practices
Dealers running their own reinsurance companies should follow consistent governance principles:
- Document retention limit decisions and the reasoning behind them
- Ensure claims processes follow defined standards — inconsistent claims adjudication is both an operational risk and a reserve integrity problem
- Verify reserve adequacy before redirecting income into external investments
- Revisit pricing assumptions whenever claims experience shifts materially from projections
- Work with administrators who provide full financial statements, not just summary reports
Most dealer owners don't want to manage this governance layer internally — nor should they have to. DealerRE's administration model covers monthly financial statements, claims monitoring, compliance filings, and periodic program reviews, so dealers stay informed without being buried in administrative detail.
Frequently Asked Questions
What is reinsurance risk modeling?
Reinsurance risk modeling is the process of using historical claims data, statistical methods, and actuarial tools to estimate future claims costs and manage financial exposure. It determines appropriate pricing, reserve levels, and capital requirements for a reinsurance program.
How does risk modeling apply to dealer-owned reinsurance programs?
Dealers who own reinsurance companies apply risk modeling concepts — including loss ratio tracking, frequency-severity analysis, and stress testing — to confirm programs are priced correctly and reserves are adequate. Without that oversight, underwriting profits can shrink well before the problem becomes visible.
What is a loss ratio and why does it matter for auto dealers?
The loss ratio is claims paid divided by premiums earned. For dealer reinsurers, it is the most direct measure of program profitability. A healthy ratio (50%–65%) means meaningful underwriting income is being retained; a rising ratio signals a need to adjust pricing, product mix, or retention limits.
What types of data are most important in dealer reinsurance risk modeling?
Data quality drives model accuracy. The most critical inputs are historical claims data by product and vehicle segment, premium volume, policy counts, vehicle age and mileage profiles, and claims development patterns over time.
How often should dealers review their reinsurance program's risk performance?
Best practice is monthly operational reviews covering loss ratios, claims activity, and reserve levels, combined with annual or every-other-year actuarial reviews of pricing assumptions. Trigger an immediate review any time unusual claims activity or major portfolio shifts occur.
What is the difference between proportional and non-proportional reinsurance for dealers?
Proportional (quota share) reinsurance shares both premiums and losses between the dealer's company and the backing insurer at a fixed ratio. Non-proportional (excess of loss) only involves the backing insurer when claims exceed a defined threshold. Admin obligor dealer programs typically use proportional quota share structures backed by A-rated carriers.