

For auto dealers evaluating or operating their own reinsurance programs, this isn't abstract finance. Every percentage point of retention directly determines whether underwriting profits stay inside the dealership's reinsurance company or flow out to a third-party product provider — permanently.
With F&I gross profit per vehicle retailed reaching $2,750 in Q4 2025 — a 14.5% year-over-year increase — the financial stakes around that retention decision have never been higher.
TL;DR
- The retention ratio = Net Written Premiums ÷ Gross Written Premiums × 100; it measures what percentage of premium a company keeps after ceding to reinsurers
- Higher retention keeps more risk and profit in-house; lower retention transfers both to outside reinsurers
- Premium is an imperfect proxy for risk — ceding 20% of premium does not necessarily transfer 20% of risk exposure
- Sustainable retention depends on capital adequacy, claims volatility, portfolio mix, and program maturity
- For dealer-owned reinsurance companies, the retention ratio shows exactly how much F&I underwriting profit stays in the dealership vs. flowing to a third party
What the Retention Ratio Means in Reinsurance
The Reinsurance Association of America defines retention as "the amount of risk the ceding company keeps for its own account." That's distinct from how "retention" gets used elsewhere in business — this has nothing to do with customer renewal rates. It's a balance-sheet concept about owned risk exposure.
Here's how the underlying structure works:
- A ceding company writes policies and collects gross written premiums (GWP)
- It transfers a portion — ceded premiums — to a reinsurer in exchange for coverage on losses above a threshold or on a proportional share
- What remains after that transfer is net written premiums (NWP)
- The retention ratio is simply the relationship between those two numbers
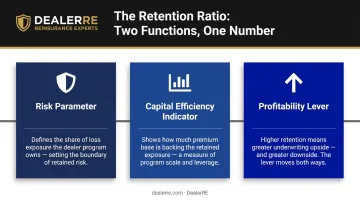
The retention ratio serves three functions at once:
- Risk parameter — defines how much loss exposure the ceding company owns
- Capital efficiency indicator — shows how much of the premium base backs that exposure
- Profitability lever — higher retention means more upside and more downside
A company with a 90% retention ratio absorbs nine times more loss exposure per dollar of premium than one running at 10%. That's not good or bad on its own — it reflects a deliberate choice about how much underwriting profit and loss the ceding company is prepared to own.
Retention vs. Cession: Two Sides of the Same Decision
Every percentage point ceded to a reinsurer reduces both loss exposure and profit potential. Every point retained does the opposite. This isn't a passive outcome of how the market works — it's a strategic tradeoff made at program setup and revisited as conditions change.
The retained portion corresponds directly to net retained liability: the losses the ceding company absorbs without any reinsurance support. That liability has direct bottom-line consequences, making the retention ratio a number worth tracking closely when evaluating program structure or pricing a new reinsurance arrangement.
How the Retention Ratio Is Calculated — and Where the Formula Breaks Down
The Core Formula
Retention Ratio (%) = (Net Written Premiums ÷ Gross Written Premiums) × 100
- Gross Written Premiums: Total premiums collected before any cessions
- Net Written Premiums: What remains after subtracting ceded premiums (and adding any premiums assumed from other insurers)
A quick example:
| Component | Amount |
|---|---|
| Gross Written Premiums | $1,000,000 |
| Ceded Premiums | $200,000 |
| Net Written Premiums | $800,000 |
| Retention Ratio | 80% |
S&P Global describes this calculation as measuring "the efficiency of a P&C insurance company" and "the percentage of businesses the company retains." That definition holds as far as accounting goes. The problem surfaces when you try to use the ratio as a measure of actual risk exposure.
Limitations of Using Premiums as a Risk Proxy
The formula assumes premium and risk scale proportionally. They don't.
CAS actuaries Cedar and Thompson documented this directly: in excess-of-loss reinsurance, "the reinsurer is typically assuming the riskier layers of business from the ceding company." Their research showed that a reinsurance cost of just $15 could reduce net required economic capital by $500 — a 33x leverage ratio between premium transferred and risk transferred.
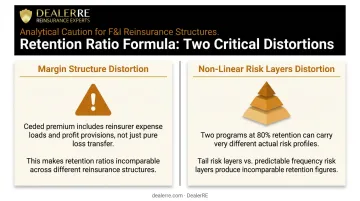
Two specific distortions embedded in the formula:
- Margin structure: The premium ceded includes reinsurer expense loads and profit provisions, not just pure loss transfer — so retention ratios aren't comparable across different reinsurance structures
- Non-linear risk layers: Companies typically cede high-severity, low-frequency tail risk while keeping predictable high-frequency exposure. Two programs at 80% retention can carry very different actual risk profiles
Treat the retention ratio as a directional indicator, not a risk scorecard. Understanding what was ceded — not just how much — is what determines whether the ratio reflects genuine risk transfer or just premium movement.
Key Factors That Influence the Retention Ratio
Portfolio Composition
The primary driver of appropriate retention is what's being insured. High-frequency, low-severity risks — like mechanical breakdown contracts on used vehicles — support higher retention because losses are predictable and actuarially manageable. Low-frequency, catastrophic-exposure lines require lower retention because a single event can overwhelm capital.
This is why, in some lines entering new markets (cyber insurance is the often-cited example), companies cede as much as 80% of all premium and loss. Predictability earns the right to retain more.
Capital Adequacy
Capital sets the outer boundary on retention regardless of risk preference. Regulatory frameworks and rating agency standards require minimum surplus relative to retained exposure.
Two benchmarks define the acceptable range for most P&C companies:
- 2:1 net premiums written to policyholder surplus — considered the standard acceptable ratio for most lines
- 3:1 — the practical ceiling; exceed this and regulators take notice
For smaller reinsurance entities — including dealer-owned programs — the capital and surplus requirements set by the domicile jurisdiction define the practical ceiling on how much risk can be retained.
Claims Volatility and Historical Loss Experience
Stable, well-documented loss histories justify higher retention. Unpredictable or worsening loss ratios push in the opposite direction.
For dealer-backed reinsurance programs specifically, this means:
- F&I product sales discipline affects what claims get filed and how legitimate they are
- Claims adjudication rigor determines whether payouts are appropriate or inflated
- Contract coverage terms define what the program is actually exposed to
Each of these factors directly shapes what the program can responsibly retain. A dealer with disciplined claims management can increase retention over time as loss data matures. A program with loose practices will find the loss ratios making that decision for them.
What a Healthy Retention Ratio Looks Like in Practice
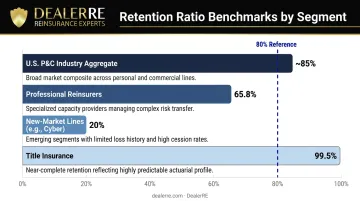
There's no single correct answer. The right retention level varies by entity type, line of business, capital position, and program maturity. Industry benchmarks from NAIC's 2024 annual report illustrate the range:
| Segment | Retention Ratio | Notes |
|---|---|---|
| U.S. P&C Industry (aggregate) | ~85% | NWP vs. direct premiums written |
| Professional Reinsurers | 65.8% | Reflects layered retrocession market |
| Title Insurance | 99.5% | High-frequency, low-severity profile |
| New-market lines (e.g., cyber) | As low as 20% | Heavy quota share during market development |
These numbers don't stand alone as verdicts. Regulators and rating agencies evaluate the retention ratio alongside surplus levels, reserve adequacy, reinsurer credit quality, and the ratio of ceded probable maximum loss to surplus. It only becomes meaningful in that full context.
The Two Failure Modes
Ceding too much premium erodes profitability. When an entity pays out more than it retains, it misses underwriting gain without equivalent risk reduction. AM Best warns that over-reliance on reinsurance creates vulnerability to "pricing fluctuations and availability in the excess reinsurance market." The comparison AM Best draws is instructive: it resembles the fragility of short-term debt financing.
Retaining too much creates a different problem. When retained exposure outpaces available capital, a spike in claims can threaten solvency. AM Best's Credit Rating Methodology flags inadequate reinsurance protection as a direct path to "impairment or insolvency caused by large shock losses."
Both failure modes reflect the same underlying problem: a mismatch between retained exposure and available capital.
How the Retention Ratio Changes When Dealers Own Their Reinsurance Company
Under a standard third-party F&I product arrangement, the retention ratio question belongs entirely to the product provider. The dealer earns a markup on sales, but underwriting profits stay with the provider. The dealer has no visibility into — and no control over — that retention decision.
When a dealer owns an admin obligor reinsurance company, the retention decision moves in-house.
The Fundamental Shift
The dealer becomes the ceding party making retention decisions directly. The retention ratio now measures how much underwriting profit stays inside the dealer's reinsurance entity versus being ceded upward to a backing insurer.
DealerRE structures these programs with A-rated backing insurers providing the security layer. Funds are held in a trust account in the dealer's reinsurance company's name, with the direct writing insurance company carrying ultimate claim liability if the reinsurance entity cannot meet its obligations.
The product categories covered in these structures span the full F&I menu:
- Vehicle Service Contracts (VSCs)
- Guaranteed Asset Protection (GAP)
- Collateral Protection Insurance (CPI) and Debt Cancellation Coverage (DCC)
- Ancillary products — Tire & Wheel, Door Ding, Windshield, Theft Protection
Each of these products generates premium that, under third-party arrangements, funds someone else's underwriting profit. In an admin obligor structure, that profit flows to the dealer's own reinsurance company.
Retention as an Active Management Tool
New programs typically start with retention levels calibrated to the dealer's volume, portfolio characteristics, and available data. As the program matures and loss experience stabilizes, higher retention becomes viable — meaning more of the premium income stays in the dealer's entity rather than being ceded away.
DealerRE's full-service administration model — covering claims adjudication, compliance, performance reports, and financials — feeds this process directly. Disciplined claims adjudication produces cleaner loss data, and cleaner loss data builds the case for increasing retention over time. Better administration means higher retention potential — which is where the real long-term profit accumulates.
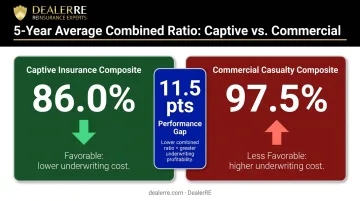
This is the core economic argument for dealer participation in reinsurance. AM Best data shows captive insurance composites achieve a 5-year average combined ratio of 86.0 versus 97.5 for commercial casualty composites. That 11.5-point gap reflects what happens when well-understood, high-frequency risk stays in a purpose-built structure instead of being ceded to a generalist insurer.
For dealers selling more than 30 vehicles per month, the volume required to support a viable program is well within reach. DealerRE has helped over 400 dealers build and manage these structures since 1994.
Frequently Asked Questions
What is the retention ratio in reinsurance?
The retention ratio measures the percentage of written premiums a ceding company keeps after transferring a portion to a reinsurer. Calculated as Net Written Premiums divided by Gross Written Premiums (×100), it indicates how much risk and profit potential the entity retains on its own books rather than passing to another party.
What is a good retention rate in insurance?
There's no universal benchmark — it depends on capital strength, line of business, and claims history. The NAIC reports that professional reinsurers averaged 65.8% in 2024, while title insurers retained 99.5%. Most P&C companies operate between those extremes, with the 2:1 net premiums written to surplus ratio as a practical capital guardrail.
How is the reinsurance retention ratio calculated?
The formula is: (Net Written Premiums ÷ Gross Written Premiums) × 100. For example, a company with $1,000,000 in gross written premiums that cedes $200,000 has $800,000 in net written premiums — an 80% retention ratio.
What factors influence the retention ratio in a reinsurance program?
The main variables are portfolio risk profile (frequency vs. severity of expected losses), capital reserves relative to retained exposure, historical claims experience and loss volatility, regulatory minimum surplus requirements, and the overall maturity of the program.
How does dealer-owned reinsurance affect the retention ratio?
In a dealer-owned admin obligor program, the dealer controls the retention decision directly, determining how much underwriting profit stays in their reinsurance entity versus being ceded to the backing insurer. That percentage can increase as the program matures and loss data builds, capturing F&I profit that would otherwise flow entirely to a third-party provider.
Can a retention ratio be too high in a reinsurance program?
Yes. Retaining more risk than the program's capital base can support creates real financial risk during high-claims periods. Retention decisions should be matched to surplus levels and documented claims experience — not simply maximized. AM Best explicitly flags over-retention as a pathway to insolvency from shock losses.