

For businesses across the insurance value chain, understanding these dynamics matters. That includes auto dealers who use reinsurance-backed F&I programs — because what happens in the broader reinsurance market eventually affects the cost and availability of the products they sell.
This article breaks down where the U.S. reinsurance market stands in 2025, what's driving it, and what it means for dealerships thinking strategically about their F&I structure.
TL;DR
- Global reinsurance capital exceeded $805 billion at mid-year 2025, creating buyer-friendly conditions in property catastrophe lines
- Loss-free property cat accounts achieved 5%–15% rate reductions at January 2025 renewals; loss-affected accounts saw increases up to 20%
- Cat bond issuance hit a record $25.6 billion in 2025, expanding alternative capacity and intensifying competition
- Casualty reinsurance faces rising costs from social inflation, nuclear verdicts, and adverse reserve development — diverging sharply from property trends
- Dealer-owned reinsurance companies sidestep third-party F&I cost volatility and retain underwriting profits directly
Property Catastrophe Reinsurance: A Buyer-Friendly Market Emerges in 2025
What "Buyer-Friendly" Actually Means
After several years of a hard market — where reinsurers held pricing power and restricted capacity — 2025 has flipped the dynamic. "Buyer-friendly" means primary insurers are seeing:
- Rate reductions on loss-free accounts
- More flexible coverage terms
- Expanded capacity from competing reinsurers
- Greater negotiating leverage at renewal
Fitch Ratings summarized it in January 2025: "The lower prices reflect an abundance of capital, with the reinsurance cycle now past its peak, but market conditions remain supportive."
Record Capital Driving Competition
The capital surplus is the core driver. According to GallagherRe's HY 2025 report, global reinsurance dedicated capital reached $805 billion at mid-year 2025 — a 4.8% increase from year-end 2024's $769 billion. Aon reported approximately $735 billion as of June 30, 2025, reflecting different index compositions but confirming the same broad trend.
This level of capital creates genuine competition among reinsurers chasing premium. The result: insurers with clean loss histories have real pricing power.
Bifurcated Pricing: Clean vs. Loss-Affected
The market isn't uniformly soft. Pricing outcomes in 2025 split sharply by loss history:
- Loss-free accounts: 5%–15% rate reductions at January 2025 renewals (Fitch Ratings)
- Loss-affected accounts: Increases up to 20%
- More remote, high-attaching layers: Most favorable conditions
- Primary insurer retention: 85%–90% of catastrophe losses absorbed before reinsurance responds
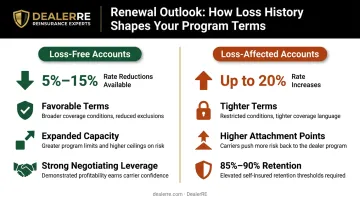
This bifurcation matters. A clean account in 2025 looks very different from one with wildfire or hurricane losses on the books.
California Wildfires and CAT Loss Context
Swiss Re reported $80 billion in global insured losses in H1 2025 alone, driven primarily by the January Los Angeles wildfires and severe convective storms. Full-year 2025 insured losses are estimated at approximately $107 billion — the sixth consecutive year above $100 billion. Yet buyer-friendly conditions have persisted.
The California wildfire losses prompted insurers to reassess wildfire exposure in their reinsurance purchasing strategies, pushing demand for higher attachment points and more granular catastrophe modeling.
Florida: Legislative Reform Rewrites the Market
Florida's story is a standout in 2025. After Senate Bill 2A (2022) and HB 837 (2023) overhauled the state's property insurance claims process and eliminated one-way attorney fees, reinsurer appetite for Florida risk improved measurably.
GallagherRe confirmed the reforms "led to a more stable and attractive insurance market in Florida, encouraging carriers and reinsurers to refocus on growing their businesses." The market response has been significant:
- 12 new carriers entered Florida since 2022
- 27 private carriers filed for rate decreases since 2024
- Florida Citizens' exposure fell 43% year-over-year, from $520.1 billion to $295.1 billion
- Policy count dropped to 777,592 from a peak of 1.4 million
That shift from state-backed to private carriers has created meaningful new demand for commercial property cat reinsurance.
Casualty Reinsurance: Pressure from Social Inflation and Nuclear Verdicts
Defining Social Inflation
Social inflation is not economic inflation. Swiss Re's sigma 4/2024 defines it as "the increased severity of insurance claims beyond that which can be explained by economic drivers." Between 2017 and 2022, U.S. social inflation ran at 5.4% annually — nearly 50% faster than general economic inflation at 3.7%.
Munich Re describes it more bluntly as "legal system abuse" — actions in the court system that systematically raise costs for defendants and, by extension, their insurers.
Three Drivers Reshaping Casualty Risk
1. Third-Party Litigation Funding (TPLF) The Westfleet Insider 2024 report recorded $3.2 billion in new capital commitments for commercial litigation funding in 2024. Total assets under management for the top 44 U.S. litigation funders reached $15.2 billion by year-end 2024. External funding enables plaintiffs to pursue and hold out for larger settlements — directly inflating claim values.
2. Nuclear Verdicts Jury awards of $10 million or more continue rising in frequency and size. Between 2013 and 2022, five states accounted for half of all U.S. nuclear verdicts:
| State | Verdicts (2013–2022) | Total Awards |
|---|---|---|
| California | 199 | $9 billion |
| Florida | 197 | $33 billion |
| New York | 131 | $4 billion |
| Texas | 130 | $16 billion |
| Georgia | 64 | $6 billion |
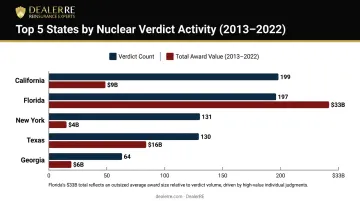
Florida's $33 billion in awards from 197 verdicts reflects extremely large individual judgments. Georgia's rise to fifth place — driven by verdicts like a $1.7 billion Hill v. Ford Motor Co. award — prompted the state's landmark tort reform in April 2025.
3. Anti-Corporate Jury Sentiment Behavioral shifts in how juries evaluate corporate defendants have made large awards more common even in cases where prior decades would have produced modest outcomes.
Casualty Market Conditions in 2025
Property cat reinsurance softened in 2025; casualty moved in the opposite direction. Moody's shifted its global reinsurance sector outlook from positive to stable in September 2025, specifically citing casualty concerns. TransRe confirmed that deterioration in 2015–2019 accident years "continues," with underperforming years still accumulating losses.
Casualty facultative markets tightened considerably as a result: reinsurers reduced capacity, raised pricing thresholds, and became more selective about which accounts they'd support. Some pulled back from casualty participation entirely; others expanded, maintaining overall capacity equilibrium but creating a far more selective underwriting environment than property lines.
Mass Tort Pressure Points
Mass torts add another layer of casualty exposure that reinsurers are still learning to price. Three categories stand out in 2025:
- PFAS ("forever chemicals"): Risk modeling projects $65 billion in corporate water contamination losses and $15 billion in bodily injury costs; over $11 billion in settlements were reached in 2023 alone, including 3M's $10 billion+ agreement
- Social media addiction litigation: Bellwether trials are now underway, with outcomes that could set precedent for platform liability at scale
- Opioid and public nuisance theories: Expanding liability frameworks continue to create difficult-to-model exposure across casualty lines
Alternative Capital, ILS Markets, and Technology: New Forces Reshaping Reinsurance
Cat Bonds Shatter Records in 2025
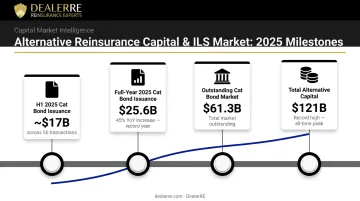
Insurance-Linked Securities (ILS) have moved from an alternative to a structural pillar of reinsurance capacity. Full-year 2025 cat bond issuance reached a record $25.6 billion — a 45% year-over-year increase — pushing the outstanding cat bond market to $61.3 billion (Artemis). In H1 2025 alone, nearly $17 billion was issued across 56 transactions, matching all of 2024 in just six months.
Total alternative capital (including sidecars and collateralized reinsurance) reached a record $121 billion in 2025 according to Aon's ILS Annual Report. Sidecars are expanding into casualty lines — a notable evolution beyond their traditional property cat focus.
This capital influx is structural, not cyclical. Pension funds, sovereign wealth funds, and institutional investors seeking uncorrelated returns have made ILS a permanent feature of the market. That permanently expands competitive capacity in property lines and keeps pricing pressure on traditional reinsurers.
Technology and Underwriting Precision
As that capital scales, technology is reshaping how reinsurers deploy it. Advanced catastrophe modeling tools — Munich Re's NatCatSERVICE ranks among the most comprehensive natural disaster databases available — enable more granular risk differentiation. Reinsurers can now price wildfire risk by property-level exposure, not broad geographic approximations.
AI and agentic analytics tools are accelerating this further. Moody's has embedded AI capabilities into its data ecosystems to identify risk insights faster. Aon's September 2025 report highlighted stronger demand for facultative reinsurance facilitated by data-driven underwriting — allowing more tailored placement strategies for complex risks.
The practical outcome is sharper differentiation across the board:
- Better accounts receive improved pricing terms
- Weaker accounts face deeper scrutiny and tighter capacity
- Complex risks increasingly move through facultative channels with bespoke structures
Technology isn't flattening reinsurance costs — it's widening the gap between well-managed and poorly-managed risk.
What's Driving These U.S. Reinsurance Trends in 2025 — and What to Watch Next
Three macro forces explain the divergent conditions shaping the 2025 reinsurance market.
Natural catastrophe loss accumulation: Six consecutive years of $100B+ insured losses have pushed insurers to buy more reinsurance protection and prompted reinsurers to reprice wildfire, flood, and convective storm exposure. The 2024 figure was $137 billion. Higher attachment points mean primary carriers absorb more before reinsurance responds.
Legal and regulatory environment: The NAIC's Credit for Reinsurance Model Law governs reinsurance credit requirements across all 56 U.S. jurisdictions. At the state level, litigation reform — or its absence — is a primary swing factor for casualty appetite.
The American Tort Reform Foundation's 2025–2026 Judicial Hellholes report ranked Los Angeles #1 and New York City #2, identifying both as high-risk jurisdictions for nuclear verdicts and abusive litigation. Georgia's April 2025 tort reforms (SB 68 and SB 69) — targeting phantom damages, seatbelt evidence, and litigation funding disclosure — are the clearest sign of pushback so far. If other states follow, expect measurable softening in casualty reinsurance pricing over the next renewal cycle or two.
Investment income and reinsurer profitability: On the property side, strong investment returns have improved reinsurer profitability and reduced pressure for further rate increases. GallagherRe reported reinsurer ROE at approximately 17% for 2024 — well above the estimated 8–10% cost of equity. That financial cushion supports a more competitive, buyer-friendly pricing stance.
Three Signals to Watch
- Nuclear verdict trajectory — Whether Georgia's reforms deliver measurable reductions, and whether federal or additional state tort reform activity gains momentum
- ILS market expansion — Continued cat bond growth and whether alternative capital migrates further into casualty lines
- CAT event impact — A major hurricane season or California wildfire event could interrupt the current soft property cycle
What Auto Dealers Should Know About the U.S. Reinsurance Market in 2025
The connection between the broader reinsurance market and an auto dealer's F&I program is more direct than most dealers realize.
When reinsurance costs rise for traditional F&I product providers — warranty companies, GAP providers, collateral protection carriers — those providers pass costs downstream. That means higher product prices, reduced program support, or compressed dealer margins. The dealer bears the consequence of a market cycle they had no hand in creating.
The Case for Dealer-Owned Reinsurance
Dealers who operate their own admin obligor reinsurance company are structurally insulated from that dynamic. Instead of sending premiums to a third-party provider who retains the underwriting profit, they direct those premiums to their own reinsurance entity — and keep the profits after claims are paid.
The structure covers the full F&I product suite: vehicle service contracts, GAP, collateral protection, debt cancellation coverage, and ancillary products like tire and wheel and windshield protection.
A-rated insurers back the program, so if the dealer's reinsurance entity can't meet its obligations, the direct writing carrier steps in. The upside stays with the dealer; the catastrophic downside risk is transferred.
DealerRE has helped over 400 auto dealers — franchise, independent, and BHPH — build and manage these programs since 1994. The admin obligor model isn't new, but the market environment in 2025 makes the conversation timely.
Three market conditions in 2025 work in favor of dealers ready to make the move:
- Buyer-friendly conditions in property reinsurance reduce program-level costs
- Growing sophistication in ILS and alternative capital markets improves competitive pricing for well-structured programs
- Dealers with clean loss histories on their reinsurance portfolios are positioned to benefit from the same split-market pricing that's rewarding loss-free property cat buyers
For dealers still relying on third-party providers, the question is straightforward: if those providers weren't profitable, they wouldn't be in business. Those profits could be staying at the dealership — funding real estate purchases, staff development, or reinvestment back into operations.
Frequently Asked Questions
How big is the reinsurance market?
Global reinsurance dedicated capital reached $805 billion at mid-year 2025 (GallagherRe), with annual written premiums totaling $394.7 billion in 2024 (Atlas Magazine). The U.S. is the world's largest single insurance and reinsurance market by premium volume, accounting for a disproportionate share of global property catastrophe demand.
What states have reinsurance programs?
Reinsurance is a private, B2B market operating in all 50 states under the NAIC's Credit for Reinsurance Model Law. State-sponsored programs — Florida Citizens, state FAIR plans, and wind pools — also purchase reinsurance to manage catastrophe exposure on behalf of their policyholders.
What is causing reinsurance prices to change in 2025?
Two opposite forces are at work. Property catastrophe pricing is softening due to record capital levels and competition from alternative capital sources. Casualty pricing is rising or holding firm due to social inflation, nuclear verdicts, and adverse reserve development on prior accident years, putting pressure on carriers with mixed books of business.
What is social inflation and how does it affect reinsurance?
Social inflation refers to claims cost increases driven by litigation trends — third-party litigation funding, nuclear verdicts exceeding $10 million, and shifting jury behavior — rather than broader economic conditions. It has materially worsened U.S. casualty loss ratios, running at 5.4% annually between 2017–2022 compared to 3.7% general inflation over the same period.
What is a dealer-owned reinsurance company?
A dealer-owned (admin obligor) reinsurance company allows an auto dealer to replace third-party F&I product providers with their own captive entity. Premiums from vehicle service contracts, GAP, and other products flow into the dealer's company, and after claims are paid, underwriting profits belong to the dealer rather than an outside vendor. A-rated insurers back the structure throughout.
How do broader reinsurance market trends affect auto dealers?
When reinsurance costs rise for third-party F&I providers, dealers typically absorb higher product costs or see reduced program support. Dealers who own their reinsurance company bypass this exposure entirely. Their program economics are determined by their own loss experience, insulating them from market cycles that squeeze external vendors.