

Introduction
What separates dealerships that hold their margins through market downturns from those that don't? The answer almost always comes back to income diversification.
Vehicle sales margins have compressed significantly. New-vehicle front-end gross profit declined for nine consecutive quarters through mid-2024, and J.D. Power projected combined new-car and F&I gross profits would drop 35% in 2024. Dealerships that depend almost entirely on front-end unit sales are exposed every time rates rise, inventory tightens, or consumer confidence softens.
The dealerships that hold up aren't doing anything exotic. They've built multiple income streams from the same customers, same facilities, and same transactions — most of which already exist in their operations but aren't fully captured.
This article breaks down the key ancillary revenue categories available to dealers today — which ones carry the highest margins, which require the least overhead, and how dealer-owned reinsurance lets dealers recapture underwriting profits that currently flow straight to third-party providers.
TL;DR
- Ancillary revenue covers income beyond core vehicle sales: service contracts, F&I products, service department work, and protection packages
- Service and parts departments now account for 49.6% of total dealership gross profit (NADA 2024)
- F&I products represent the highest-margin ancillary category, with top performers averaging over $2,500 PVR
- Dealer-owned reinsurance lets dealers capture the underwriting profits that normally go to third-party F&I providers
- Consistent presentation and staff training drive F&I performance more than product selection alone
What Is Ancillary Revenue for Auto Dealers?
Ancillary revenue is income generated from products or services that are supplementary to a dealership's primary business of selling vehicles. In a dealer context, that means everything from service department labor to F&I products, car wash revenue, protection packages, and parts sales.
Front-end gross has compressed. Fixed costs haven't. That gap is exactly why ancillary revenue has moved from a nice-to-have to a core profitability lever.
According to NADA 2024 data, service and parts departments contributed 49.6% of total dealership gross profit — more than new and used vehicle sales combined. The average dealership generated over $8.17 million in total gross profit, but a meaningful share of that came from sources other than selling cars.
F&I tells an even sharper story. Across a 202-dealership sample tracked by VisionAST, F&I now accounts for 73% of total per-deal profit, up from 56% just one year earlier. Front-end sales profit in that same sample fell by 67% over the period.
The Strategic Decision Dealers Face
Not all ancillary revenue is created equal. There's a meaningful difference between how these streams are built, staffed, and scaled:
- Body shops, car washes, towing, and rental fleets demand real facility investment, dedicated staffing, and management bandwidth before they produce returns.
- Service contracts, GAP, and protection products attach directly to the transaction — minimal incremental cost, no new infrastructure, layered onto an F&I process that already exists.
Dealers who understand this distinction can sequence their investments — instead of trying to build every revenue stream simultaneously.
Key On-Lot and Service-Based Ancillary Revenue Sources
Service Department: The Foundation
The service department is the most reliable ancillary revenue channel most dealers already have. Average dealer service and parts revenue reached approximately $9.23 million in 2025, up 33% over the prior eight years, according to Cox Automotive's 2026 Fixed Ops and Ownership Study.
More important than the revenue number is what service does for customer retention. Research consistently shows:
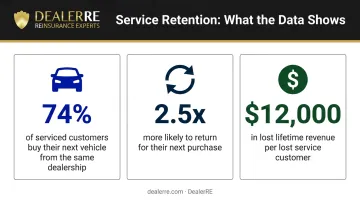
- 74% of customers who have their vehicle serviced at a dealership are likely to buy their next vehicle from that same store
- Service customers are 2.5x more likely to purchase their next vehicle from the servicing dealership
- A single lost service customer represents approximately $12,000 in lifetime dealership revenue
Fixed operations gross profit for publicly traded dealer groups grew 8.1% year-over-year in Q4 2024, one of the few bright spots in a year of compressed front-end margins.
Car Washes, Body Shops, and Rentals
These three ancillary categories share a common characteristic: they require more upfront investment but can become self-sustaining profit centers.
Car washes have genuine appeal as a dealership add-on. The U.S. car wash services market was valued at $15.28 billion in 2025. One dealership case study from DRB featured a Cleveland Heights store where an on-site express exterior tunnel became the dealership's second-highest net profit department. Recent tax law changes also matter here — the reinstated 100% bonus depreciation through 2029 under the One Big Beautiful Bill Act and doubled Section 179 limits to $2.5 million can meaningfully shorten payback periods.
Body shop and collision repair benefits from two structural tailwinds. Average vehicle age in the U.S. hit a record 12.8 years in 2025, meaning more vehicles worth repairing rather than replacing. The average total cost of repair finished 2024 above $4,730.
EV growth adds another dimension: EV collision repairs averaged $6,587 versus $4,215 for all vehicles and take longer to complete, creating demand for certified technicians with EV-specific skills.
Vehicle rentals remain underutilized by most dealers. Most have ceded this space to Enterprise, Hertz, and Avis by default.
Modern rental management technology has reduced the overhead that made in-house programs impractical. An internal rental fleet generates direct revenue while creating additional customer touchpoints.
Other lower-lift additions worth considering:
- Parts sales and detailing add margin to existing service visits
- F&I aftermarket accessories increase per-transaction profitability without new infrastructure
F&I Products: The Most Impactful Ancillary Revenue Driver
For most dealerships, F&I is where ancillary revenue potential is highest and overhead is lowest. Products are sold at the point of transaction with no additional facility, no additional headcount, and minimal incremental cost.
Average F&I gross profit for publicly traded dealership groups reached $2,501 per vehicle retailed (PVR) in Q4 2024 — the highest since Q3 2022. In a 202-dealer sample tracked by VisionAST, overall F&I PVR came in at $1,818, with financed deal PVR averaging $2,456.
The Core F&I Product Categories
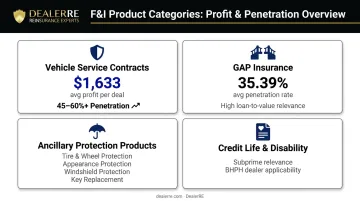
Four product categories drive the majority of F&I income:
- Vehicle Service Contracts (VSCs) — The top revenue contributor. Profit per deal averaged $1,633 in the most recent tracked period (up from $1,344 the prior year). Average penetration runs 45–50%; top departments exceed 60%.
- GAP insurance — The volume play in high loan-to-value environments. Americans carried $1.616 trillion in auto loan debt as of Q2 2024, with an estimated 1.6 million repossessions that year. VisionAST sample GAP penetration sat at 35.39% — still with meaningful room to grow.
- Ancillary protection products — Tire and wheel, appearance protection, windshield repair, key replacement, and theft deterrent are expanding as a share of total F&I income. Tire and wheel profitability rose more than $37.95 per deal; appearance product profits increased $93.77 on financed vehicles. Products per deal (PPD) grew 1.5% in the most recent six-month period.
- Credit life and disability insurance — Particularly relevant in BHPH and subprime contexts. These products protect the dealer's receivables while generating premium income, especially for customers where a job loss or health event directly threatens the payment stream.
The Performance Gap Is a Training Gap
The difference between average and top-performing F&I departments isn't the product menu. It's consistency of presentation. Top F&I performers maintain PPD ratios of 2.0 or higher and VSC penetration above 60% — significantly above where most average dealers land.
Structured menu presentation and consistent F&I training close that gap — not swapping products. Dealers who invest in both typically see penetration rates move within 90 days.
The Profit You're Not Capturing
Most dealers focus on front-end gross and F&I PVR. Far fewer track where that F&I income actually goes after the deal closes.