Introduction
While many dealers closely watch front-end gross profit margins, F&I departments have become the primary profit engine for auto retailers nationwide as vehicle margins continue to compress. In Q3 2025, publicly traded auto retail groups generated an average of $2,534 in F&I gross profit per vehicle retailed (PVR), while front-end margins slipped to historic lows. By December 2025, nearly 9 out of 10 gross dollars per deal came from F&I—not the vehicle sale itself.
Yet despite strong F&I revenue, many dealers fail to optimize their product mix, penetration rates, or profit-sharing structure. Most cede substantial backend profits to third-party warranty and insurance providers who bear none of the customer acquisition cost.
The real question is whether your dealership is capturing every dollar it has earned—or handing a significant share to providers who weren't part of the sale.
TL;DR
- F&I PVR reached $2,534 across publicly traded groups in Q3 2025, while front-end gross margins fell to $279 per deal by December 2025
- VSCs and GAP insurance lead on penetration (45% and 39%) and deliver the strongest gross profit per deal
- Average new vehicle prices of $50,326 and 72–84 month loan terms make protection products a straightforward sell
- Tire & wheel and appearance protection plans are gaining momentum with low administrative burden and high dealer margins
- Dealers who own their reinsurance capture 100% of F&I product income instead of paying third-party providers
Why F&I Products Are the #1 Profit Driver for Auto Dealers in 2026
The structural shift is unmistakable. While front-end gross profit has been declining year-over-year, F&I PVR has climbed consistently higher. StoneEagleDATA reported that in December 2025, front-end gross margins fell to just $279 per deal—the lowest level since January 2022—while F&I PVR reached $1,995 in Q4 2025. For context, top-performing public groups like AutoNation posted F&I PVR of $2,891 in Q4 2025.
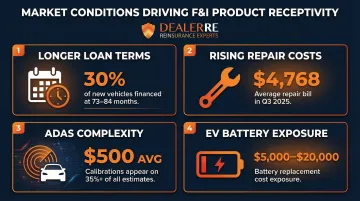
Market conditions have made F&I products a more natural conversation at the desk. The average new vehicle transaction price hit an all-time high of $50,326 in December 2025, and buyers are stretching their financing further than ever. Several converging data points explain why customers are more receptive to F&I products today:
- Longer loan terms: Nearly 30% of new vehicles are financed over 73–84 months, up from 26% a year earlier
- Rising repair costs: Average repair bills reached $4,768 through Q3 2025, according to CCC Intelligent Solutions
- ADAS complexity: Calibrations average $500 per vehicle and appear on over 35% of estimates
- EV battery exposure: Replacement costs range from $5,000 to $20,000, making coverage a legitimate concern for EV buyers
With repair costs climbing and loan terms lengthening, the value case for F&I products practically writes itself. The rankings below identify which specific products are producing the strongest returns in 2026, measured by penetration rates, gross margin, and customer acceptance.
Most Profitable F&I Products for Auto Dealers in 2026
These five products consistently generate the highest gross profit per deal and are showing strong penetration momentum in 2026, supported by recent industry data from StoneEagle and public dealer financial reports.
Vehicle Service Contracts (VSCs)
VSCs—commonly called extended warranties—are the single highest-penetration F&I product in the industry. StoneEagleDATA reported a 45% penetration rate at U.S. dealerships in Q4 2025, up from 43% a year earlier. Rising repair costs on technology-loaded vehicles make the sale concrete: a single ADAS calibration now runs $500 and appears on over a third of repair estimates, giving customers a tangible reason to buy coverage at the point of sale.
Dealer profit potential is substantial. VSCs typically carry the highest gross profit margin of any F&I product per deal, with sample data showing average profits exceeding $1,100 to $1,400 depending on coverage level and vehicle type. Dealers who retain risk through a reinsurance structure—rather than paying a third-party administrator—capture 100% of underwriting profits on top of that front-end margin.
Vehicle Service Contracts Performance Metrics
| Metric | Data |
|---|---|
| Typical Industry Penetration Rate | 45% (Q4 2025) |
| Average Dealer Gross Profit Per VSC | $1,100–$1,400+ per contract |
| Best Vehicle Segment | New and used vehicles with high repair cost exposure, including luxury and tech-loaded models |

GAP Insurance
GAP (Guaranteed Asset Protection) covers the difference between a vehicle's actual cash value and the outstanding loan balance after a total loss or theft. Elevated transaction prices and extended loan terms have made this product more relevant than ever.
Edmunds reported that in Q4 2025, 29.3% of trade-ins toward new-vehicle purchases carried negative equity—the highest share since Q1 2021—with the average underwater amount hitting an all-time high of $7,214.
GAP delivers strong dealer margins with relatively predictable claims frequency. Industry penetration reached 39% in Q4 2025, up from 35% a year earlier. The combination of high loan-to-value ratios, long loan terms, and elevated transaction prices gives F&I managers a straightforward case to make—and generates consistent profit for dealers.
GAP Insurance Performance Metrics
| Metric | Data |
|---|---|
| Typical Industry Penetration Rate | 39% (Q4 2025) |
| Average Dealer Gross Profit Per GAP Policy | Varies by provider and structure; most programs deliver margins comparable to ancillary products with lower claims volatility than VSCs |
| Best Vehicle Segment | Financed new and used vehicles with high loan-to-value ratios and buyers using 72+ month terms |
Prepaid Maintenance Plans
Prepaid maintenance bundles scheduled services—oil changes, tire rotations, inspections—into a single upfront cost. The dual profit benefit is immediate F&I income at the point of sale plus long-term service department revenue and customer retention. StoneEagleDATA reported 17% penetration for prepaid maintenance in Q4 2025.
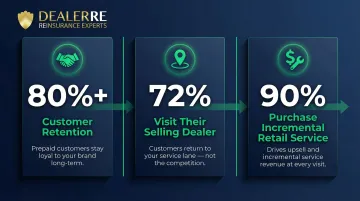
While penetration lags VSC and GAP, prepaid maintenance has near-zero claims risk for dealers and drives consistent service lane traffic. The retention numbers tell the story:
- Dealerships see over 80% retention among customers who purchase prepaid maintenance plans
- Plan holders visit their selling dealer at a 72% rate
- 90% of plan holders purchase incremental retail service during those visits
That upsell behavior turns prepaid maintenance into one of the few F&I products that keeps paying out long after the deal closes.
Prepaid Maintenance Plans Performance Metrics
| Metric | Data |
|---|---|
| Typical Industry Penetration Rate | 17% (Q4 2025) |
| Average Dealer Gross Profit Per Plan | High margins; near-zero claims risk with long-term service revenue upside |
| Best Vehicle Segment | New vehicles and certified pre-owned programs where service retention is a priority |
Tire & Wheel Protection
Tire and wheel plans cover road hazard damage including potholes, nails, and curb damage. Rising tire replacement costs and aging road infrastructure have increased customer receptivity to this product. StoneEagleDATA reported 10% penetration for tire and wheel protection in Q4 2025.
Tire and wheel is typically a lower-ticket, high-margin ancillary product that bundles well with VSCs and raises overall products-per-deal metrics. The industry average products-per-deal reached 1.58 in Q4 2025, up from 1.53 a year earlier. With tire replacement costs surging due to tariffs—Sumitomo announced price increases up to 25% and Yokohama up to 10%—customers are paying more attention to tire replacement costs than they have in years.
Tire & Wheel Protection Performance Metrics
| Metric | Data |
|---|---|
| Typical Industry Penetration Rate | 10% (Q4 2025) |
| Average Dealer Gross Profit Per Plan | High margins; VisionAST data shows profitability increased by over $65 since 2022 |
| Best Vehicle Segment | New vehicles and markets with high road hazard exposure or extreme weather conditions |
Appearance Protection Plans
Appearance protection—paint sealant, fabric guard, interior and exterior coverage—has gained consistent penetration as vehicle ownership costs rise. StoneEagleDATA reported 20% penetration for paint and fabric protection in Q4 2025. As average transaction prices climb, buyers are more receptive to protecting what they've paid for.
Appearance plans typically carry low claims rates and high dealer margins, making them one of the most profitable ancillary products on a cost-versus-revenue basis. Sample data shows average profitability of $687.96 per plan. A January 2026 survey by XPEL found that 96% of auto dealers believe applying Paint Protection Film (PPF) helps retain vehicle value, with 70% citing value-retention gains of up to 15%.
Appearance Protection Plans Performance Metrics
| Metric | Data |
|---|---|
| Typical Industry Penetration Rate | 20% (Q4 2025) |
| Average Dealer Gross Profit Per Plan | ~$688 per plan with low claims frequency |
| Best Vehicle Segment | New vehicles and pre-owned vehicles where buyers are focused on resale value and long-term condition |
How to Get More Out of Every F&I Product You Sell
The dealers achieving the highest F&I PVR figures consistently invest in F&I manager coaching, menu selling, and presenting products as financial protection tools rather than upsells. StoneEagle CEO Cindy Allen noted that top-performing dealerships simplify their F&I menus and measure data on a daily or weekly basis, which drives higher attachment rates and PVR. Training and process drive penetration—not aggressive sales tactics.
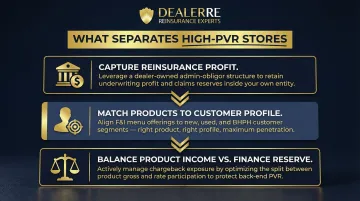
Three practices separate high-PVR stores from the rest:
- Capture reinsurance profit: Most dealers share backend profit with third-party providers by default. A dealer-owned admin-obligor structure—like the programs DealerRE has built for over 400 dealers nationwide—lets the dealership recapture 100% of that profit, turning each deal into a long-term revenue stream instead of a one-time commission.
- Match products to your customer profile: New vehicle buyers, used car buyers, and BHPH customers carry different risk profiles and affordability thresholds. A well-designed F&I menu tailored to each customer's situation improves both acceptance rates and satisfaction.
- Balance product income against finance reserve: As refinancing activity rises—Experian reported a nearly 70% year-over-year increase in Q2 2025—overreliance on reserve income creates chargeback exposure. Aftermarket product chargebacks are actively squeezing dealer F&I profits, so managing cancellation risk proactively is no longer optional.
How We Evaluated These Products
Each product was ranked against four criteria:
- Industry penetration rates and products-per-deal metrics from StoneEagleDATA's Q4 2025 benchmark report
- Average dealer gross profit per unit sold, drawn from publicly available dealer financial reports and VisionAST profitability analyses
- Customer acceptance trends across franchise, independent, and BHPH dealerships
- Relevance to 2026 market conditions — affordability pressure, rising vehicle complexity, elevated prices, and longer loan terms
Common Selection Mistakes to Avoid
Dealers often chase product volume over profitability, or choose providers based on relationships rather than margin structure. The strongest F&I product strategy aligns customer needs with dealer profit goals and accounts for the full cost difference between third-party and proprietary programs.
If your provider isn't transparent about backend profit retention, you're handing underwriting profits to someone else — profits your dealership earned.
Conclusion
The most profitable F&I products in 2026—VSCs, GAP, prepaid maintenance, tire and wheel, and appearance protection—share a common thread: they protect buyers against escalating vehicle ownership costs while delivering consistent, growing gross profit for dealers even as front-end margins compress.
Product selection is only half the equation, though. Look beyond the product menu and evaluate whether you're capturing the full economic benefit of your F&I operation — or giving away backend profits to third-party providers who bear little of the customer acquisition cost.
When third-party warranty and insurance companies keep the underwriting profits your customer base generates, you're building their bottom line, not yours.
DealerRE has helped over 400 auto dealers nationwide build their own admin-obligor reinsurance programs — capturing the underwriting profits from these same products instead of passing them to third parties. Contact DealerRE at (804) 824-9533 to learn how a dealer-owned reinsurance structure can transform your F&I department's long-term profitability.
Frequently Asked Questions
What is the most profitable F&I product for auto dealers?
Vehicle Service Contracts consistently rank as the single highest gross profit F&I product per deal, followed closely by GAP insurance. VSCs posted 45% industry penetration in Q4 2025 and typically deliver $1,100 to $1,400+ in dealer gross profit per contract sold.
What is a good F&I gross profit per vehicle retailed (PVR)?
Recent industry benchmarks show publicly traded dealer groups averaging $2,400–$2,500+ PVR in 2025, with AutoNation reporting $2,891 PVR in Q4 2025. Top-performing independent dealers can exceed these figures through optimized product mix, penetration training, and dealer-owned reinsurance structures.
How can dealers improve F&I product penetration rates?
Consistent menu selling, active F&I manager coaching, and framing products as value tools rather than add-ons drive penetration gains. Top performers simplify their menus, track data weekly, and deliver a compliant F&I presentation to every customer regardless of credit profile or vehicle type.
What is GAP insurance and why is it profitable for dealers?
GAP covers the shortfall between a vehicle's actual cash value and the outstanding loan balance in a total loss or theft. It carries strong dealer margins with predictable claims frequency—especially valuable in today's high-loan-amount market where 29.3% of trade-ins carry negative equity averaging $7,214.
How does dealer-owned reinsurance increase F&I profitability?
An admin-obligor reinsurance structure lets dealers keep the underwriting profits that normally flow to third-party providers. Rather than earning only front-end gross on each sale, dealers capture 100% of the spread between premiums collected and claims paid—building a long-term, compounding income stream.
Are these F&I products relevant for independent and BHPH dealers?
Independent and BHPH dealers see strong returns from VSCs, GAP, appearance protection, and ancillary products. Programs can be structured and priced to fit specific customer bases and inventory profiles, with premium financing options available for BHPH operations to protect cash flow while building customer-funded repair pools.