
What Is a Loss Ratio in a Dealer Warranty Program (And Why Should You Care)?
Picture this: You're a dealer principal who's been selling 20 vehicle service contracts (VSCs) every month, assuming your warranty program is profitable. Then you discover that the third-party provider has quietly absorbed tens of thousands in reserve that never came back to you. The number that determines how much of that reserve is profit—and who keeps it—is the loss ratio.
For dealers—whether you run a BHPH lot or a franchise store—the loss ratio is the core metric that determines whether your warranty program generates profit you keep or profit you hand to a third-party provider. This post covers what the number actually means, what benchmarks to target, what moves it up or down, and how tracking it changes how you manage your program.
TLDR: Key Takeaways
- Loss ratio = total claims paid ÷ total premiums earned; healthy dealer warranty programs target 40%–60%
- Below 40% may signal overpricing or restrictive coverage; above 65%–70% indicates unsustainable claim costs
- BHPH dealers often see higher loss ratios than retail/franchise dealers due to older, higher-mileage inventory
- Third-party models keep favorable loss ratio profits; dealer-owned reinsurance puts that money back in your pocket
- Dealers who actively track loss ratio gain pricing control and build long-term reinsurance profitability
What Is a Loss Ratio in a Dealer Warranty Program?
In plain terms, loss ratio is the percentage of earned premium (or contract reserve) that's paid out in claims. You calculate it by dividing total claims paid by total warranty premium collected.
Simple example: If you collect $100,000 in premiums and pay $50,000 in claims, your loss ratio is 50%.
How Dealer Warranty Programs Differ from Standard Insurance
In a VSC or limited warranty program, the "premium reserve" is the portion of the contract price set aside to pay mechanical claims. According to industry analysis, the retail cost of a VSC typically breaks down as follows:
- Dealer markup: Often 50% or more of the retail price (retained immediately)
- Dealer cost: The remainder, split between admin/marketing fees and the reserve (usually less than 30% of total retail cost)
The loss ratio specifically measures how much of that reserve is consumed by claims versus retained as underwriting profit. Admin fees, agent commissions, and insurance costs sit outside this calculation.
Reserve Structure and Who Captures the Profit
When you sell a VSC, typically 70%–80% of the contract price goes into reserve to fund future claims. The remaining 20%–30% covers admin and fees. The loss ratio tells you what percentage of that reserve is actually used—and what percentage represents profit.
| Model | Who Keeps the Underwriting Profit |
|---|---|
| Third-party warranty | The warranty company retains it |
| Dealer-owned reinsurance | Accumulates in your trust — fully owned by you |
In a dealer-owned structure like the programs DealerRE administers, that profit stays with the dealer instead of flowing to a third-party provider.
Loss Ratio Benchmarks: What Numbers Should Dealers Target?
Industry benchmarks vary depending on program structure, inventory profile, and how "loss ratio" is measured. Here's what recent sources indicate:
Published benchmarks:
- CBT News (Feb 2026): Industry benchmarks often target a loss ratio around 70%, though this varies by franchise brand, region, and product mix. A 98% loss ratio signals the need for immediate review of labor rates, claim severity, and reserve positioning.
- F&I Direct (Jan 2024): High-performing reinsurance programs typically feature VSC loss ratios between 25% and 45%, ancillary product loss ratios under 20%, and blended loss ratios in the 30–40% range.
That spread in benchmarks comes down to how "loss ratio" is calculated — whether against full retail premium (including dealer markup) or against the net premium ceded to the reinsurance entity. The calculation method matters as much as the number itself.
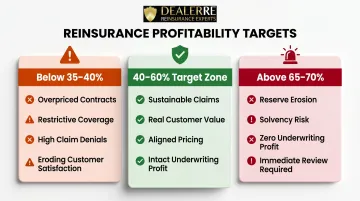
General target zone: For most dealer VSC programs, a loss ratio between 40%–60% is considered financially healthy. Claims are sustainable, customers receive real value, and the program retains meaningful underwriting profit.
What Different Loss Ratio Levels Signal
Below 35%–40%:
- Contracts may be overpriced relative to actual vehicle risk
- Coverage terms could be too restrictive
- Claim denial rates might be unusually high
- Can erode customer satisfaction despite appearing profitable
40%–60% (Target Zone):
- Claims are sustainable and predictable
- Customers experience real value from coverage
- Pricing and risk are properly aligned
- Underwriting profit remains intact without squeezing coverage
Above 65%–70%:
- Claims are outpacing the reserve
- Threatens program solvency
- Eliminates underwriting profit entirely
- Requires immediate program review and adjustment
BHPH vs. Retail/Franchise Dealer Benchmarks
BHPH dealers typically see higher loss ratios than retail or franchise dealers. The reason is straightforward: vehicles sold are older, higher-mileage, and more mechanically vulnerable. Published BHPH-specific benchmarks are sparse, but the operational reality is that these programs can run profitably at higher loss ratio thresholds, as long as contract pricing is calibrated to actual inventory risk.
Key consideration: NIADA research emphasizes that BHPH dealers should update acquisition strategies quarterly using warranty claims data to better align inventory risk with contract pricing.
Time Horizon: Why 12 Months Minimum Matters
Avoid benchmarking loss ratios on a single month's data. Actuarial analysis shows that VSC claim emergence timing makes short-period ratios unreliable. For a 5-year new car contract, typical loss emergence follows this pattern:
- Year 1: 5%
- Year 2: 15%
- Year 3: 25%
- Year 4: 30%
- Year 5: 25%
As little as 2–5% of total losses may emerge in Year 1. Monthly snapshots will systematically understate the true loss ratio of a growing book. Evaluate over a rolling 12-month period at minimum.
Segment by Product Type
A blended program-wide number hides important variance. Segment your loss ratio by:
- Contract type — VSC vs. limited powertrain vs. ancillary products
- Vehicle age and mileage tier — newer, lower-mileage inventory behaves very differently from older BHPH stock
- Coverage scope — comprehensive bumper-to-bumper vs. named-component contracts
Each segment tells a different story. Treating them as one number leads to mispricing and missed profit opportunities.
What Factors Drive a Dealer's Loss Ratio Up or Down?
Several operational and inventory factors directly impact your loss ratio. Understanding these drivers helps you manage performance proactively.
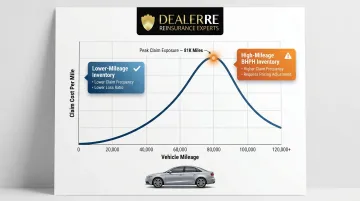
Vehicle Age and Mileage Profile
Inventory composition is the single largest driver of loss ratio variance.
According to CAS actuarial research, unscheduled repair and maintenance costs per mile rise during the first 81,000 miles, then decline toward the end of a vehicle's life. Dealers selling older vehicles with higher mileage will naturally see more mechanical claims.
If you don't adjust contract pricing to inventory risk, you're essentially subsidizing the warranty company—or draining your own reinsurance reserve. High-mileage vehicles require either higher reserve allocation or narrower coverage terms to maintain a healthy loss ratio.
Contract Coverage Terms and Claim Eligibility
Broader coverage (more covered components, fewer exclusions) increases claim frequency and the loss ratio. Narrower terms protect the reserve but can reduce perceived customer value.
Match coverage scope to the actual risk profile of vehicles being sold. Don't default to the most comprehensive or cheapest available contract — customize based on inventory. DealerRE structures VSC options across the spectrum, from long-term exclusionary wraps for newer vehicles to short-term powertrain contracts for high-mileage inventory, so the product fits the vehicle rather than the other way around.
Claims Adjudication Quality
How claims are reviewed and approved has a significant effect on the loss ratio:
- Weak adjudication: Allows inflated repair invoices, unnecessary replacements, or improper claim approvals to drain the reserve
- Overly aggressive denial: Damages customer relationships and satisfaction
- Proper adjudication: Balances legitimate claim payment with cost control
CBT News recommends a "deep dive" into labor rates, claim severity, and reserve positioning when loss ratios elevate. For dealers with in-house service departments, how warranty repairs are written up shapes claim costs.
In a dealer-owned reinsurance program, you have direct visibility into adjudication processes — and the ability to hold them to a consistent standard. DealerRE's full-service administration includes claims adjudication, keeping that process professional while protecting your underwriting profit.
Sales Volume and Reserve Funding Consistency
Loss ratios are more stable and meaningful at scale:
- Low volume (5 VSCs/month): One large claim can spike the loss ratio to 200%+ in that period, creating extreme volatility
- Higher volume (20–30 VSCs/month): Produces smoother, more predictable ratios that can be meaningfully managed over time
Scale also matters for data integrity. CAS actuarial analysis warns that subdividing claims into too many coverage combinations creates datasets "too sparse for traditional actuarial projections" — enough data to feel real, but not enough to act on confidently.
Service Department Alignment and Repair Cost Management
For dealers with in-house service operations, how warranty repairs are priced affects claim costs and the loss ratio:
- Overpriced labor rates inflate claim severity
- Unnecessary parts replacements drain the reserve
- When you own your reinsurance program, those inflated costs come directly out of your own underwriting profit
- Aligning service pricing with realistic market rates protects the reserve without sacrificing customer satisfaction
Why Loss Ratio Matters More When You Own Your Reinsurance Company
Under a standard third-party warranty program, the loss ratio determines the warranty company's profit, not yours. Whether the ratio is 30% or 55%, you receive a flat commission or capped profit-share—the rest goes to the third party.
The Financial Shift: Third-Party vs. Dealer-Owned
Under a third-party model, if you generate $800 in reserve per VSC and pay out $400 in claims (50% loss ratio), the remaining $400 underwriting profit goes to the warranty company—not to you.
In DealerRE's admin obligor reinsurance program, your reinsurance company holds the reserve. At a 50% loss ratio, that same $400 per contract accumulates as underwriting profit inside your reinsurance trust—owned by you.
Here's what that looks like at scale: 20 contracts per month at $800 reserve per contract with a 50% loss ratio:
- Monthly reserve contributions: 20 × $800 = $16,000
- Annual reserve contributions: $16,000 × 12 = $192,000
- Claims paid (50% loss ratio): $96,000
- Underwriting profit retained: $96,000
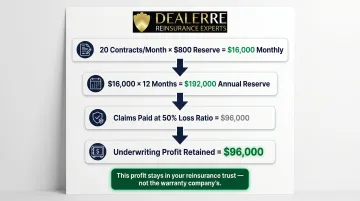
This $96,000 accumulates in your dealer-owned reinsurance trust, plus any investment income earned on reserves held between product sale and claims payment.
Loss Ratio Becomes an Active Management Tool
In a reinsurance model, loss ratio monitoring shifts from passive statistic to active management tool:
- Shows how your trust account is growing month over month
- Reveals whether contract pricing is calibrated correctly
- Flags when program adjustments are needed before problems compound
- Gives you financial visibility and control that third-party arrangements simply don't offer
Mercer Capital research describes reinsurance profits as "countercyclical to vehicle sales," providing a financial buffer during sales downturns. Properly managed participation companies can evolve into "meaningful balance sheet assets" and "cash-generating entities."
Tax Advantage Layer: IRS Section 831(b)
Dealer-owned reinsurance companies structured under IRS Section 831(b) receive favorable tax treatment:
- 2026 threshold: Companies with less than $2,900,000 in annual net premiums qualify for the 831(b) election
- Tax treatment: Taxed only on investment income—underwriting income is excluded from federal income tax
- IRS scrutiny threshold: Operating below a 30% loss ratio may trigger increased disclosure requirements under micro-captive regulations
Note: Consult a tax professional for specific guidance. DealerRE manages all legal filings, tax returns, and compliance documentation as part of program administration.
Retro vs. Reinsurance: The 50% Difference
The tax structure matters, but so does the program structure underneath it. Industry data shows that under retrospective commission (retro) arrangements, dealers typically receive approximately 50% fewer dollars than in a full reinsurance arrangement—and retro payments are taxed at the dealership's ordinary income tax rate.
In a dealer-owned warranty company (DOWC) structure, the dealer's corporate entity assumes contractual responsibility and retains 100% of underwriting profits. The math shown above tells you what that difference is worth.
How Dealers Can Actively Manage and Improve Their Loss Ratio
Managing your loss ratio takes deliberate action — the dealers who protect reinsurance profitability treat it as an ongoing operational discipline, not a quarterly report review.
Review Loss Ratio by Contract Segment, Not Just Aggregate
Break down your loss ratio by:
- Vehicle make/model/age range
- Contract term and mileage tier
- Coverage type (comprehensive vs. powertrain)
- New vs. used inventory
This reveals which inventory segments generate disproportionate claim costs and allows for targeted pricing corrections or coverage adjustments. While DealerRE's performance reports provide comprehensive financial analysis, dealers should request segmented data to identify specific risk areas.
Invest in F&I Training to Improve Product-to-Vehicle Matching
VSCs sold on vehicles that don't fit the coverage profile will drag up the loss ratio. High-mileage vehicles enrolled in comprehensive coverage at the same pricing as lower-risk vehicles create adverse selection that inflates claims.
Proper F&I training ensures:
- Coverage terms reflect actual vehicle risk
- Contract pricing aligns with inventory profile
- Product selection matches customer needs and vehicle condition
- Reduced adverse selection that drives up claim costs
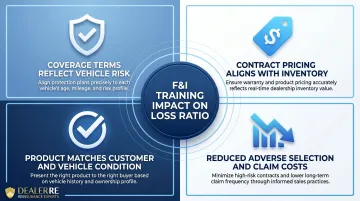
DealerRE provides F&I training and development as part of program support, helping dealers align product offerings with inventory reality.
Establish a Regular Performance Review Cadence
Industry best practices recommend:
- Monthly: Review cession statements and basic performance metrics
- Quarterly: Conduct in-depth advisor reviews with detailed analysis
- Annually: Comprehensive top-down program review
Look for early warning signs:
- Rising loss ratio driven by specific vehicle type
- Claim concentration from specific repair shops
- Specific coverage categories generating outsized losses
Catching a skewed loss ratio at month three is far easier to correct than at month twelve. Repricing a high-risk segment or tightening a coverage category early keeps reserve balances intact. DealerRE's full-service administration includes ongoing performance monitoring and strategic recommendations to support that process.
Additional Management Strategies
Beyond structured reviews, four operational habits consistently move loss ratios in the right direction:
- Avoid flat pricing across all vehicle types — higher-risk inventory requires higher reserve allocation or adjusted coverage terms
- If you run in-house service, verify warranty repair pricing aligns with market rates and isn't inflating claim costs
- Track claim frequency by mechanical system to identify which components drive outsized losses and adjust coverage accordingly
- Each quarter, scan for patterns in repair shops, claim types, or specific vehicle makes that signal a pricing correction is needed
Frequently Asked Questions
What is an acceptable dealer warranty loss ratio?
For most dealer VSC programs, a loss ratio between 40%–60% is considered acceptable and financially healthy. Below this range may suggest overpricing or overly restrictive claims, while above 65%–70% signals claims are eroding the reserve faster than it can sustain underwriting profit.
What is a VSC (vehicle service contract) in car sales?
A VSC is an agreement sold by a dealer that covers the cost of specific mechanical repairs after the manufacturer's warranty expires. It's not technically an insurance policy but functions similarly, with a premium reserve set aside to pay future claims.
How is the loss ratio for a dealer warranty program calculated?
Total claims paid divided by total warranty premiums (or reserve) collected, multiplied by 100. It should be measured over a rolling 12-month period rather than month-to-month to account for the uneven timing of warranty claims.
What causes a dealer's warranty loss ratio to be too high?
Three issues account for most high-ratio situations:
- Selling comprehensive coverage on high-risk or high-mileage inventory without adjusting contract pricing
- Weak claims adjudication that allows inflated repair invoices to pass through
- Low sales volume, where a small number of large claims skew the ratio
Do BHPH dealers have different loss ratio benchmarks than retail dealers?
Yes. BHPH inventory is typically older and higher-mileage, leading to higher claim frequency. BHPH programs may see loss ratios that run higher than retail programs while remaining operationally viable, provided contract pricing is calibrated to the inventory risk profile.
How does dealer-owned reinsurance change who benefits from a favorable loss ratio?
Under a third-party warranty model, the provider keeps any underwriting profit from a favorable loss ratio. In a dealer-owned reinsurance program like those administered by DealerRE, the remaining reserve after claims accumulates as profit inside your own reinsurance trust. That makes the loss ratio a direct measure of your own financial performance.