Introduction
Many dealers operate a reinsurance program but have never conducted a formal audit. They rely on their provider's assurances that everything is performing well, unaware that money is likely leaking through fees, claims inefficiencies, or poor product selection. A well-structured program should generate significant retained profit, but without regular verification, you're trusting instead of confirming.
A reinsurance audit is a structured review covering four critical areas: fee structure, claims performance, product mix, and investment activity. Two figures illustrate why regular audits matter:
- Fees can absorb approximately 30% of VSC premium before it reaches your reinsurance entity
- Repair costs have climbed 36% over the past four years, eroding margins in programs built under older assumptions
Programs designed three years ago may no longer reflect current economic realities.
That gap is what this guide addresses. It walks through the documents you need, the four areas to audit, how to interpret results, and what to do when something looks wrong.
Key Takeaways
- Audit four core areas: fee structure, claims performance, product mix, and investment/reserve activity
- Admin fees aren't the only cost: ceding fees, premium taxes, and adjudication charges all reduce net profitability
- Healthy programs maintain 50-65% loss ratios over 3-5 years, with consistent premium flow into the reinsurance entity
- Claims reports should be reviewed on 30-, 60-, and 90-day rolling windows, with full audits conducted bi-annually
- Involve a reinsurance specialist if audit results reveal structural gaps or sustained negative trends
What You Need Before You Start the Audit
A reinsurance audit is only as useful as the documents feeding it. Before reviewing anything, gather the right materials from your administrator or provider. A provider who is unwilling or slow to supply these documents raises immediate concerns about transparency and program governance.
Documents and Reports to Collect
Request these core items from your reinsurance administrator:
- Quarterly and annual reinsurance financial statements
- Loss ratio reports (total claims paid divided by net premium collected)
- Claims adjudication reports on 30-, 60-, and 90-day rolling windows
- Fee disclosure schedules breaking out admin, ceding, claims adjudication, premium tax, and ancillary fees
- Product premium summaries by contract type (VSC, GAP, ancillary products)
- Trust and investment account statements showing asset allocation and reserve growth
A full-service administrator should provide all of these as part of standard program administration — no special requests required. If you have to push for access to your own financials, that's a structural problem worth resolving before the audit goes any further.
Setting the Baseline
With documents in hand, the next step is establishing context. How long has the program been active? What is total premium volume ceded annually? What structure is in place — CFC, NCFC, or DOWC?
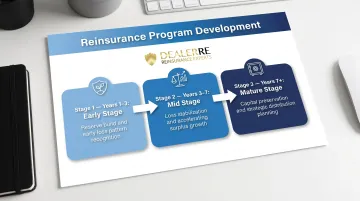
These variables set the benchmark for evaluating performance:
- Years 1-3 (Early Stage): Focus on reserve build and early loss patterns
- Years 3-7 (Mid Stage): Monitor loss stabilization and surplus acceleration
- 7+ Years (Mature Stage): Emphasize capital preservation and distribution planning
How to Audit Your Reinsurance Fee Structure
Fee structure is the most commonly neglected audit area. Dealers often compare programs on admin fee alone, but the true cost is the sum of every fee applied before premiums reach your reinsurance entity.
Step 1 — Identify Every Fee Being Charged
Line-item every fee category:
- Administrative fee: Per-contract flat fee or percentage of premium
- Ceding fee: Percentage retained by administrator before funds are ceded
- Claims adjudication fee: Percentage of net claim amount or flat per-claim charge
- Premium tax: State-level tax, often bundled or listed separately from admin fee
- Ancillary costs: Roadside assistance, reporting, technology, compliance, investment management
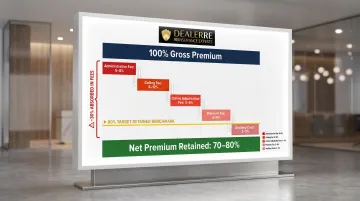
Industry sources report approximately 30% of VSC premium is absorbed by fees, often totaling $300 or more per contract. Well-structured programs should keep fees at 20% or less, with 80% or more flowing to the premium reserve.
Step 2 — Calculate Net Premium Actually Reaching the Reinsurance Entity
Use this formula:
Net Premium = Gross Contract Premium - All Pre-Cession Fees
If you believe you're capturing 80% of premium but ceding fees and taxes reduce that to 60%, your investment base and potential underwriting profit are materially lower than expected. This ripple effect also suppresses investment income. An additional 5% expense drag compounded over 10 years can cost millions in lost surplus for a mid-size dealer group.
Step 3 — Compare Fee Structure Across Program Types
Low admin fees often come with higher ceding fees or bundled charges that are harder to see. Build a side-by-side comparison using net premium retained — not the gross admin fee — as your benchmark. Ask your provider for a fully unbundled fee disclosure, and weigh total net return against the structural support, reporting quality, and fund access each program actually delivers.
Verify Current Fees Against Actual Statements
Fee schedules do change — confirm the current disclosure matches your actual quarterly statements, not just the original agreement. If fees applied don't match what was disclosed, escalate it with your administrator before the next quarter closes.
How to Audit Claims Performance and Loss Ratios
Claims performance reveals whether your program is collecting enough premium to cover losses and whether claims are being handled consistently with contractual coverage.
Step 1 — Pull the 30-, 60-, and 90-Day Claims Reports
Rolling claims reports allow you to identify emerging trends before they become structural problems. A single bad month is noise; a consistent upward trend in claim frequency or severity over 90 days is a signal worth investigating.
These reports should show:
- Number of claims filed
- Average claim cost
- Claims by product type
- Reserve adequacy against expected future claims
Step 2 — Calculate and Benchmark the Loss Ratio
Loss Ratio = Total Claims Paid ÷ Total Net Premium Collected
Healthy long-term loss ratios fall between 50-65% for mature programs measured over 3-5 years. Ratios below 45% may signal claims friction or excessive exclusions; ratios above 70% indicate structural underpricing.
Loss ratios vary by product:
- VSCs: 25-45% in high-performing programs
- Ancillary products: Often under 20%
- Blended programs: 30-40% when ancillary products are weighted heavily
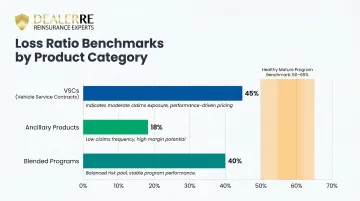
Segment loss ratios by product type to identify which lines drive or erode profitability.
Step 3 — Review Rate Adequacy Against Loss Trends
Rates need to reflect current repair costs and claims trends. Key cost benchmarks to compare against your current pricing:
- CPI (motor vehicle maintenance & repair): Reached 449.68 in March 2026 — roughly a 36% cumulative increase since March 2022
- Labor rates: Now averaging $125-$180 per hour at most shops
- Parts markups: Dealership markups running 40-60% above cost
If rates haven't been adjusted in 12+ months while losses have crept up, the program is undercollecting. Compare current rates against trailing 12-month loss severity data.
Step 4 — Confirm Claims Are Being Adjudicated Within Contractual Terms
Each quarter, review a sample of paid claims to confirm they align with what the service contract actually covers. This protects the program from paying out-of-scope claims and keeps adjudication rigorous.
Some providers pay borderline claims without pushback to maintain customer satisfaction scores, which erodes the reinsurance fund over time. Disciplined claims management is a core feature of any well-run program.
Formal fraud detection protocols can save dealers more than $100,000 annually. Fraud accounts for an estimated 10-20% of total claims costs — making detection protocols one of the highest-ROI controls in the audit process.
How to Audit Your Product Mix and Investment Performance
Two often-overlooked audit areas—product selection and investment/reserve growth—determine whether a reinsurance program builds long-term wealth or delivers only marginal returns.
Evaluating Product Mix
Not every F&I product belongs in a reinsurance program. Products with highly volatile or unpredictable loss ratios can introduce unnecessary risk if not properly structured or spread across a large book of business.
Stable long-term performers:
- Vehicle service contracts
- Limited warranties
- Appearance protection
- Tire-and-wheel protection
High-volatility products:
- GAP (especially in high LTV environments)
- Specialty coverage with aggressive term lengths
GAP is particularly sensitive to macroeconomic variables. Used car prices declined for seven consecutive months in 2023, reaching 9% below peak, while average new vehicle loans rose from $32,480 in 2019 to $41,665 in 2023. A dealer with a healthy overall loss ratio could face sudden deterioration from GAP alone.
Review which products are currently reinsured and whether each product's loss ratio justifies its inclusion. Ancillary products with low loss ratios can meaningfully boost surplus.
Evaluating Investment and Reserve Performance
Premiums ceded into the reinsurance trust should be invested and growing. Investment income generated over the contract term is a significant component of total program return.
Review trust account statements for:
- Asset allocation — confirm funds are diversified across appropriate asset classes
- Yield and return rate — verify returns are reasonable given the trust's risk profile
- Reserve growth — check that reserves are scaling proportionally with premium volume
- Management fees — flag any proprietary fund fees that may be eroding net returns

UPR (unearned premium reserve) accounts must hold conservative assets at a minimum of 105% of UPR, typically in government bonds or high-rated corporate bonds. Surplus "B" accounts permit equities and higher-yield securities, allowing broader investment control.
Flat or declining trust assets despite positive premium flow point to one of three problems: high claim payouts, excessive fee drag from management costs, or underperforming investment allocations. Any of these warrants a direct conversation with your administrator.
Frequency and Oversight
Review investment and product mix performance bi-annually alongside claims data. As dealership volume grows, ownership changes, or the F&I product lineup shifts, a program that was well-structured two years ago may no longer fit today's operation. Regular reviews keep the program aligned with current goals — not past assumptions.
How to Interpret Your Audit Results and Common Mistakes to Avoid
Interpreting the Results
A healthy audit shows:
- Net premium flow is consistent and aligns with disclosed fee structure
- Loss ratios fall within 50-65% for mature programs, 30-40% for ancillary-heavy programs
- Claims reports show no sustained upward trend in severity or frequency
- Trust assets are growing proportionally to premium volume
- The dealer has clear, accessible reporting from their provider at all times
Warning signs requiring immediate attention:
- Loss ratios trending above benchmarks for two or more consecutive quarters
- Net premium significantly lower than expected after fee application
- Trust assets flat or declining despite positive premium flow
- Rates unchanged for 12+ months while repair costs have increased
- Claims being paid outside contractual terms
- Limited visibility into program financials
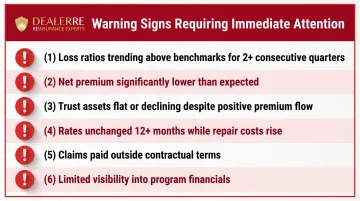
When two or more of these signals appear together, the program likely needs a structural review, not just a conversation with the current provider. DealerRE works with dealers to analyze program performance and restructure programs that aren't returning what they should.
Common Audit Mistakes Dealers Make
Avoid these consequential errors:
1. Comparing programs on admin fee alone
This is the single most common way dealers underestimate program costs. A program advertising a 15% admin fee but charging 8% ceding fees and 3% premium tax effectively costs 26%, not 15%.
2. Reviewing the program only at year-end
Annual reviews allow negative trends to compound undetected. Rolling 90-day claims reports catch problems early when they're still correctable.
3. Skipping specialized tax and legal guidance
Dividends, loans, and program restructuring carry significant tax consequences. Acting without specialized guidance creates costs that are often hard to reverse.
Frequently Asked Questions
What is a reinsurance audit?
A reinsurance audit is a structured review of a dealer's reinsurance program covering fees, claims performance, product mix, and investment activity. It confirms the program is retaining maximum profit and identifies where money is leaking or structural improvements are needed.
How often should dealers audit their reinsurance program?
At minimum, conduct a full audit bi-annually, with claims reports reviewed on a rolling 30-, 60-, and 90-day basis throughout the year. This cadence catches negative trends early and allows for timely rate or product adjustments.
What documents do I need to audit a dealer reinsurance program?
You need quarterly and annual financial statements, fee disclosure schedules, loss ratio and claims reports, product premium summaries by contract type, and trust/investment account statements. Your administrator should provide all of these on request.
What is a healthy loss ratio for a dealer reinsurance program?
Healthy long-term loss ratios typically fall between 50-65% for mature programs measured over 3-5 years. Product-level ratios vary: VSCs often run 25-45%, ancillary products under 20%. Sustained ratios above 70% signal the program is undercollecting or overclaiming relative to premium.
What fees should dealers look for beyond the admin fee in a reinsurance program?
Look for ceding fees, claims adjudication fees, premium taxes, and ancillary costs such as reporting, technology, compliance, and investment management fees. Collectively, these determine the true net premium reaching the reinsurance entity. In many programs, 30% or more of gross premium is absorbed before funds are ceded.
What are the warning signs that a dealer reinsurance program is underperforming?
Watch for any of the following:
- Rising loss ratios over consecutive quarters
- Net premium consistently lower than projected
- Flat or declining trust assets
- Rates unchanged for 12 months or more
- Limited or delayed reporting access
- Claims paid outside contractual terms
When multiple signals appear together, a structural review is warranted.