
Tracking reinsurance profitability differs fundamentally from reading a dealership P&L. Results depend on layered inputs: loss ratios, reserve performance, investment returns, and product mix. Dealers who don't monitor these components often misread their program's health entirely, mistaking distributions for profit or failing to detect underperforming products before they erode years of accumulated value.
Key Takeaways
- Profitability flows from three streams: underwriting profit, investment income, and claims performance
- Track loss ratio, combined ratio, reserve adequacy, and return on premium quarterly
- Review claims monthly, performance quarterly, and run a full program deep dive annually
- Most programs fail due to "set it and forget it" mentality — not structural flaws
- Full-service administrators provide the reports, bookkeeping, and compliance support that turn numbers into decisions
Key Metrics to Track in Your Dealer Reinsurance Company
Understanding profitability requires tracking the right numbers. Not all of these appear on standard dealership financial statements, which means dealers need reporting specific to reinsurance operations.
Loss Ratio
What percentage of your earned premiums are actually going out the door in claims? That's what loss ratio tells you — and it's the foundational metric for program health.
Calculation: Total claims paid ÷ total earned premiums = loss ratio (%)
Published benchmarks vary by source and program maturity:
- VSC loss ratios: 25-45%, according to F&I Direct's 2024 benchmarking data
- Ancillary product loss ratios (tire and wheel, GAP, appearance): 10-25%
- Blended healthy range: Elite FI Partners cites 50-65% for mature programs evaluated over 3-5 year rolling periods
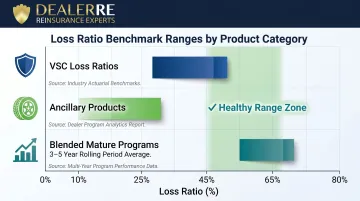
A loss ratio that climbs too high signals claims are depleting reserves faster than premiums replenish them. One that's unusually low may indicate weak penetration or product misalignment. The right range depends on product mix — programs weighted toward ancillary products typically run lower loss ratios than VSC-heavy portfolios.
Underwriting Profit
Underwriting profit is the difference between premiums collected and claims paid, after administrative costs. It's the primary wealth-building mechanism in any reinsurance program and must be tracked separately from investment income. Dealers who conflate the two lose visibility into where performance gains — or losses — actually originate.
Consistent underwriting profit signals healthy product selection and strong F&I penetration. When this number declines, the cause is usually rising claims frequency, inadequate pricing, or a shift in customer behavior worth investigating.
Reserve Adequacy
Reserves are the funds held to cover future claims obligations. Whether that balance is sufficient relative to open contracts — reserve adequacy — is what determines program solvency.
Dealers should confirm:
- Reserves are calculated using sound actuarial assumptions
- Reserve balance grows proportionally to volume
- Regulatory capital requirements are met (varies by domicile)
Domicile requirements vary: Turks and Caicos requires net worth equal to 20% of premium up to $5M, while the Cayman Islands uses tiered minimum capital thresholds based on license class. Dealers approaching premium limits or moving through rapid growth should review reserve adequacy every quarter, not annually.
Investment Income and Return on Trust Assets
Premiums held in trust generate investment income between policy sale and claims payment. This creates a second profit stream — one that can account for 20-30% of total wealth built over time.
Track both:
- Investment yield: Annual return percentage
- Total return on trust assets: Growth relative to reserve obligations
Performance depends on the investment strategy and trust structure. Most programs use an A/B account model:
- A account (restricted/UPR): Typically limited to 10% equities, 90% fixed income
- B account (surplus/earned): No restrictions once funds are earned
Earned funds left in cash — or surplus that never moves from A to B — don't compound. Over a 10-year program, that inaction can represent hundreds of thousands of dollars in foregone returns.
Premium Penetration Rate
Penetration rate tells you what percentage of vehicle sales resulted in an F&I product being sold and ceded into the reinsurance company. It's the volume driver everything else depends on.
No amount of investment discipline compensates for thin premium volume. Industry benchmarks include:
- Used vehicle VSC penetration: approximately 46%, per Michigan Dealer Service data
- Combined product penetration: 65% (modeling assumption from F&I Direct)
- All-mechanical coverage sold: 64%, per J.D. Power reporting
Low penetration limits the reserve pool, constrains investment income, and leaves programs vulnerable to claim shocks.
How to Track Your Dealer Reinsurance Company Profitability
Tracking isn't a one-time event. It's a recurring process tied to specific reports, review schedules, and decision triggers.
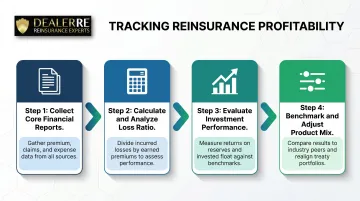
Step 1: Collect Your Core Financial Reports
Three documents form the foundation:
- Reinsurance company income statement — shows premiums earned, claims paid, admin fees, and net income
- Reserve fund balance/trust account statement — tracks total reserves, investment performance, and account splits (A vs. B)
- Claims report — itemizes open and closed claims, broken down by 30-, 60-, and 90-day aging
These should be provided monthly at minimum. A reputable administrator like DealerRE provides full-service financial reporting, bookkeeping, and performance analysis, so dealers can act on it without maintaining a separate accounting team.
Step 2: Calculate and Analyze Your Loss Ratio
Run this calculation quarterly:
Total claims paid ÷ total earned premiums = loss ratio (%)
Compare the result against:
- Your program's historical loss ratio
- Benchmarks provided by your administrator
- Product-specific ranges (VSC vs. ancillary)
A sudden spike may indicate a claims surge on a specific product, changes in customer driving patterns, or mispriced coverage. According to Automotive News/EasyCare, a loss ratio creeping toward 50% is a critical red flag requiring immediate investigation.
Step 3: Evaluate Investment Performance Against Expectations
Compare actual investment returns from your trust account against the projected yield agreed upon when the program was structured.
If trust assets are underperforming, take these steps:
- Consult your investment manager or trust bank about reallocation
- Confirm whether returns are keeping pace with projected future claims liability
- Review account structure (A vs. B splits) for rebalancing opportunities
Step 4: Benchmark Results and Adjust Product Mix or Pricing
Benchmarking involves comparing current performance against prior periods and any industry norms your administrator can provide.
Key comparisons:
- Loss ratio by product category
- Underwriting profit per unit sold
- Penetration rate trends
If a specific product — such as tire and wheel, GAP, or VSC — consistently drags loss ratios up, adjust pricing, tighten eligibility criteria, or reassess whether it belongs in the program. Ancillary products typically carry lower loss ratios than VSCs and can strengthen overall profitability when included strategically.
What You Need to Track Your Reinsurance Profitability Effectively
Profitability tracking only works when the reports you receive are accurate, the program structure is understood, and reviews happen on a set schedule.
Accurate and Timely Reports from Your Administrator
The quality of your tracking depends directly on the quality of your reporting. Confirm your administrator provides:
- Itemized claims reports
- Earned premium schedules
- Reserve balance statements
- Investment trust reports
These should arrive on a defined schedule — not just when you ask for them. If you're chasing reports, you're already behind on identifying trends.
A Baseline Understanding of Your Program's Structure
Before you can read profitability reports accurately, you need to understand what drives the numbers. At minimum, know:
- Which products are ceded into your reinsurance company
- How your reserve formula is calculated
- What the investment strategy covers
- What fees are included in your program costs
Without this baseline, profitability reports are difficult to interpret. Request a program overview document and review it annually.
A Defined Review Cadence
Tracking only works if it happens consistently. Recommended schedule:
- Monthly: Review claims reports and premium flow
- Quarterly: Review loss ratios and investment performance
- Annually: Comprehensive profitability analysis
Industry sources recommend quarterly benchmarking reviews, with deeper audits every 12-24 months. Quarterly check-ins give you a window to course-correct before small issues compound into structural problems.
Variables That Affect Your Dealer Reinsurance Profitability
Profitability fluctuates. Understanding the variables behind those changes separates smart program management from guesswork.
F&I Product Selection and Claims Exposure
Not all products carry the same risk profile. VSCs typically show loss ratios of 25-45%, while ancillary products run 10-25%. The mix of products ceded into the reinsurance company directly affects loss ratios and overall program profitability.
Programs weighted toward ancillary products with low loss ratios often show stronger underwriting margins than VSC-heavy programs.
Sales Volume and Premium Flow
Reinsurance profitability is volume-dependent. Lower unit sales mean fewer premiums entering the reserve pool, which constrains investment income and leaves the program more vulnerable to claim shocks.
Seasonal dips in vehicle sales have a lagged effect on reinsurance performance. Dealers should anticipate these rather than react after the fact.
Claims Management Philosophy
Dealer-owned reinsurance gives dealers control over claims decisions. How that control is exercised has a direct impact on profitability and customer retention. A well-defined claims philosophy should balance three priorities:
- Protect underwriting margins — approving borderline claims too liberally erodes profit over time
- Preserve customer relationships — an overly restrictive approach drives customers away and hurts retention
- Create consistency — documented guidelines keep claims decisions predictable and defensible
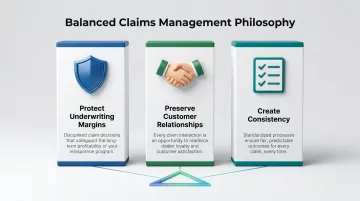
The right approach protects both profit margins and the dealership's reputation. That philosophy should be defined and written into the program's operating guidelines before claims volume scales up.
Common Mistakes When Tracking Dealer Reinsurance Profitability
These mistakes don't happen because dealers are careless — they happen because reinsurance programs are easy to misread without the right framework.
Treating the reinsurance company as a passive account
Many dealers check their program only when distributions are due or when prompted by their administrator. This "set it and forget it" mentality means negative trends go undetected for quarters at a time, compounding losses before corrective action is taken.
Conflating cash distributions with profit
Distributions from a reinsurance program are not the same as profit. Funds distributed are drawn from reserves, and if reserves have not sufficiently exceeded claims obligations, distributions can actually weaken the program. Always review reserve adequacy before treating a distribution as evidence of profitability.
Ignoring product-level performance
Reviewing only total program performance masks which individual products are performing well versus dragging results. A single underperforming product category can skew overall loss ratios without triggering obvious alarm bells in aggregate reports. Request product-line reporting that breaks down claims and earned premiums by product type.
To avoid each of these pitfalls, build these habits into your regular review process:
- Schedule quarterly program reviews independent of distribution cycles
- Compare reserve balances against outstanding claims obligations before drawing funds
- Request product-line breakdowns that separate claims and earned premiums by category
Frequently Asked Questions
How to calculate dealer profitability in a reinsurance company?
Profitability is calculated by combining underwriting profit (premiums earned minus claims paid and administrative costs) with investment income from trust assets. Review results as a return on premium and benchmark against prior periods to identify whether the program is improving or declining.
How profitable is reinsurance for auto dealers?
Profitability varies based on sales volume, product mix, loss ratios, and investment performance. Well-run programs can generate significant annual income — published examples show accumulated value exceeding $3 million over five years for dealerships selling 150 units per month at 65% penetration.
What reports should I review to track my dealer reinsurance company's performance?
Review three core reports: the program income statement, the trust/reserve balance statement, and the claims aging report. A full-service administrator should provide all three on a defined monthly or quarterly schedule.
How often should I review my reinsurance program's financial statements?
Review claims reports monthly, loss ratio and investment performance quarterly, and conduct an annual comprehensive profitability analysis. Most administrators recommend a minimum of two deep-dive reviews per year to stay ahead of any performance shifts.
What is a good loss ratio for a dealer reinsurance company?
Loss ratios vary by product type. VSCs typically carry loss ratios of 25-45%, while ancillary products run 10-25%. A sustainable program generally maintains a loss ratio that allows underwriting profit after administrative fees are accounted for.
What is the difference between underwriting profit and investment income in reinsurance?
Underwriting profit is the surplus of premiums over claims and admin costs, while investment income is earned on reserves held in trust between policy sale and claims payment. Both contribute to total profitability, and tracking them separately is essential to understanding where performance gains or losses originate.