

Introduction
Most dealer-owned reinsurance programs are managed the same way they were in the 1990s: a year-end call, a PDF summary, maybe a quarterly glance at distributions. For a program that can represent one of the most significant profit centers in a dealership, that's a surprisingly passive approach.
The problem isn't access to data. Dealers with reinsurance companies already receive financials, claims summaries, and performance reports. The problem is that most of that data goes unread — or gets pulled too late to matter.
F&I now accounts for 58% of total dealership profit as of early 2024. For dealers who own their reinsurance company, that number carries even more weight.
The underwriting profit, investment income, and claims experience that third-party providers retain is now sitting in your program. Whether you capture its full value depends almost entirely on how well you use the data it generates.
This article covers what reinsurance analytics means for auto dealers, which KPIs matter most, how to build a practical reporting framework, and how smarter data habits translate directly to F&I profitability.
TL;DR
- Reinsurance analytics means using program data — claims, loss ratios, reserves, product mix — to make proactive decisions, not just react after problems surface
- The four analytics types (descriptive, diagnostic, predictive, prescriptive) each have a direct role in managing your reinsurance company
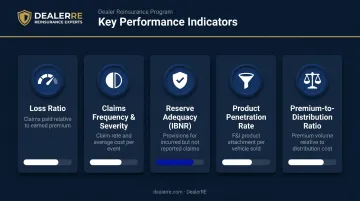
- Five KPIs map program health: loss ratio, claims frequency/severity, reserve adequacy, product penetration, and premium-to-distribution ratio
- Start with a consistent review cadence — that move from spreadsheets to structured reporting doesn't require a technology overhaul
- Dealers who review data monthly catch problems months before year-end reviews would reveal them
What Reinsurance Analytics Actually Means for Dealers
Reinsurance analytics is not the same as checking your account balance. It's the ongoing process of collecting, organizing, and interpreting program data — claims history, loss ratios, reserve levels, product performance — to make better decisions about how your reinsurance company is run.
The distinction matters because dealer-owned reinsurance gives you something third-party warranty providers will never hand over: full visibility into your own claims experience and underwriting results.
When you pay a third-party provider, they keep that data. They use it to price products, manage reserves, and retain profit. In a dealer-owned structure, that data belongs to you — which means so does the decision-making power behind it.
That visibility only creates value if it's actively used. Industry observers have described the insurance sector as suffering from a "spreadsheet addiction," with back-office teams relying on manual data processing that creates real gaps in timely decision-making. Dealer-owned reinsurance programs face the same risk — not because the data isn't there, but because few dealers have a structured habit of using it.
What that data can tell you, when reviewed consistently:
- Claims trends — which products are paying out more than projected and why
- Loss ratios — whether your program is priced correctly relative to actual experience
- Reserve levels — whether funds set aside match your exposure
- Product performance — which F&I products are generating the most underwriting profit
Dealers who build a consistent analytics practice capture more of what their program actually earns. Those who don't are making decisions based on outdated numbers — and leaving real money on the table.
The 4 Types of Analytics and How They Apply to Your Program
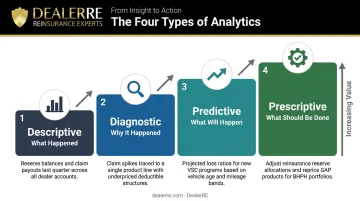
Gartner defines four core analytics types as a progression, where each layer builds on the one before it. All four apply directly to managing a dealer-owned reinsurance company.
Descriptive Analytics: What Happened
Descriptive analytics is the foundation — it answers the basic questions: how many claims were paid last quarter, what was the total loss ratio, which products generated the most claims, and what do reserves look like right now?
Most dealers who receive monthly financials are already doing some descriptive analytics — they just may not be reviewing it consistently or tracking trends month over month. The value of descriptive data compounds when you look at it the same way, every month, so you can spot changes.
Diagnostic Analytics: Why It Happened
Diagnostic analytics moves past the numbers to ask what caused them. If VSC claims spiked last quarter on used vehicles in the $15,000–$20,000 price range, diagnostic analysis helps you determine whether the cause was:
- Product pricing that underestimated repair frequency for that vehicle segment
- Vehicle selection at the point of sale (older models, higher mileage)
- A shift in customer demographics or financing terms
- A specific make or model driving disproportionate claims
This level of analysis drives smarter F&I decisions at the dealership level — not just in the reinsurance company.
Predictive Analytics: What Will Happen
Historical claims data becomes genuinely useful when it starts pointing forward. For dealer reinsurance programs, predictive analytics has three practical applications:
- Reserve adequacy planning — knowing whether current reserves will be sufficient as contracts mature
- Product expansion/contraction timing — identifying when a product's claims trend signals a need for repricing or restriction
- Distribution planning — using claims emergence patterns (how quickly losses develop over a contract's life) to forecast when surplus funds will be genuinely available
VSC claims don't emerge evenly over a contract's life. Actuarial data shows used vehicle contracts tend to generate roughly half of total losses by the time one-third of the contract term has elapsed. Understanding that pattern helps dealers avoid taking distributions too early.
Prescriptive Analytics: What Should Be Done
Prescriptive analytics translates data insights into specific recommended actions. This is where data becomes a direct profit lever. For dealer reinsurance programs, prescriptive outputs might look like:
- Adjust F&I product emphasis away from a high-severity product toward one with better loss performance
- Tighten vehicle eligibility criteria for VSC coverage on models with deteriorating claims trends
- Time a distribution based on reserve surplus calculations, not just account balance
- Retrain F&I staff when penetration data shows a drop in specific product categories
Most dealer programs operate primarily at the descriptive level. Moving up the ladder — even one layer — directly improves how profits are managed and when decisions get made.
Key Data Points Every Dealer Should Track
Not all data is equally useful. The goal is a focused set of KPIs that directly reflect program health. Think of it as a reinsurance dashboard — whether it's automated or a structured monthly review document.
Loss Ratio
Loss ratio = claims paid ÷ premiums earned. It's the single most important metric in your program.
A deteriorating loss ratio, one trending upward over several quarters, signals one of three things: product pricing is too thin, vehicle selection at point of sale is creating adverse risk, or claims management has a gap.
Historical actuarial data from the Casualty Actuarial Society shows VSC policy-year loss ratios can swing dramatically — from 96% in 1990 to over 103% the following year. Dealers cannot assume stability; they have to measure it.
A healthy reinsurance program does not survive on a loss ratio that exceeds the program's expense structure. If yours is climbing, the monthly number tells you before the damage compounds.
Claims Frequency and Severity by Product
Track both dimensions:
- Frequency — how often claims occur per contract, which directly affects your administrative cost load
- Severity — the average cost per claim, which determines reserve exposure on high-cost repairs
A high-frequency/low-severity product (like tire and wheel) may still be profitable. A low-frequency/high-severity product could create reserve risk that doesn't show up until a major claim hits. Looking at only one dimension misses the story.
Reserve Adequacy
Reserves must cover both open claims and IBNR (incurred but not reported) obligations. IBNR represents claims that have already occurred but haven't been filed yet. For dealer-owned programs, underfunded reserves are the most common silent threat to distributions and program stability.
Monitoring reserve levels relative to claims trends, not just as an absolute dollar figure, shows you what's genuinely distributable versus what needs to stay in the program.
Product Penetration Rate
Which F&I products are being sold, at what rates, and how do those rates connect to your program's premium income? A drop in VSC penetration before it shows up in financials is an early warning you can act on. Catching it early — through F&I training, menu adjustments, or sales process review — keeps it from becoming a revenue problem.
Premium-to-Distribution Ratio
Understanding how much earned income is available for distribution versus how much must stay in the program to maintain health is essential for personal financial planning. Dealers who use reinsurance income to fund real estate, reinvestment, or retirement need this number to plan responsibly. Taking distributions when the ratio doesn't support them weakens the program. Know the number before you move the money.
Moving From Spreadsheets to Smarter Reporting
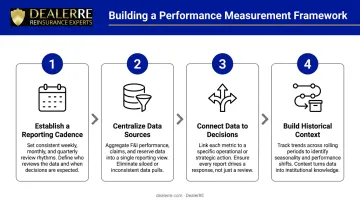
The gap between having data and using it is usually a process problem, not a technology problem. Here's a practical framework that works without a software overhaul.
Step 1: Establish a Reporting Cadence
Commit to monthly reviews at minimum — keeping the same metrics, same format, and period-over-period comparisons. A monthly reinsurance review should cover:
- Loss ratio update vs. prior month and prior year
- Claims activity summary (count, total paid, average severity)
- Reserve status relative to open and projected claims
- Premium income and product mix
- Penetration rates by product
Consistency matters more than sophistication. One structured monthly review beats four ad hoc annual conversations.
Step 2: Centralize Your Data Sources
Dealer reinsurance data often lives in multiple places: the administrator's system, the F&I menu platform, the DMS, and personal financials. The practical step is designating a single reporting document where key metrics are consolidated each month.
DealerRE's full-service administration model handles this consolidation for you. Through Assured Vehicle Protection (AVP), monthly financial statements covering all reinsurance operations activity are prepared as a standard deliverable, so you're not building reporting infrastructure from scratch.
Step 3: Connect Data to Decisions
Reports only create value when they trigger action. Build a simple decision framework around your metrics:
- If loss ratio exceeds threshold → review claims adjudication and vehicle eligibility criteria
- If penetration drops below baseline → revisit F&I training and menu presentation
- If reserves exceed required level → evaluate timing for a distribution
- If claims severity is trending up on a specific product → consider repricing or restricting that coverage
This closes the loop between analytics and profitability.
Step 4: Build Historical Context Over Time
One month of data is a snapshot. Three years of data tells you whether what you're seeing is seasonal, structural, or a one-time event. Dealers who maintain organized historical records gain a real edge. They can measure the impact of F&I process changes, spot recurring seasonal patterns in claims, and make long-term decisions backed by actual evidence rather than instinct.
That's a competitive advantage unique to dealer-owned reinsurance: the data belongs to you, not a third-party provider.
How Analytics Translates to Dealer Profitability
The financial connection is direct:
- Dealers who track loss ratios can make better product pricing decisions before problems compound
- Dealers who monitor reserves avoid over-distribution that destabilizes the program
- Dealers who analyze claims by product can discontinue underperforming products before they become significant losses
Beyond program management, analytics supports the broader wealth-building potential of dealer-owned reinsurance. When reserves are healthy and loss ratios are favorable, dealers can time distributions strategically — reinvesting in the dealership, funding real estate, or planning for retirement — rather than guessing at the right moment.

DealerRE's full-service model includes performance reporting and analysis specifically so dealers can make those decisions with expert support rather than in isolation. The company also coordinates with insurance tax experts and helps dealers align distributions with personal financial goals, which requires knowing the program's actual health, not just its cash position.
That same data matters beyond the dealership, too. A well-documented claims history and healthy program metrics support stronger standing with the A-rated insurers who back admin obligor programs. Clean data makes it easier to maintain program continuity and negotiate favorable terms over time.
Common Data Mistakes That Cost Dealers Money
Mistake 1: Waiting until year-end to review program data.
This is the most expensive data habit in dealer reinsurance. A claims spike that begins in March may not surface in a year-end review until December — nine months during which the loss ratio has been deteriorating, reserves have been eroding, and distributions may have been taken that the program couldn't actually support. AutoSuccess has identified reactive monitoring as one of the top reinsurance mistakes dealers make, specifically calling out the failure to review loss trends and claims activity on a quarterly basis at minimum.
Monthly is better.
Mistake 2: Confusing cash flow with program health.
A dealer can receive distributions while the underlying loss ratio is deteriorating. Cash in the account is not the same as a healthy program. As Baker Tilly has noted, effective reinsurance management requires understanding the distinction between immediate liquidity and long-term program health, which means monitoring loss reserves consistently, not just account balances.
Without a consistent reporting framework, this disconnect goes unnoticed until it creates a program crisis. The fix is straightforward:
- Track loss ratio and reserve adequacy every month
- Review these figures separately from cash position and account balances
- Flag any quarter where reserves decline even if distributions continue
Frequently Asked Questions
What is reinsurance analytics?
Reinsurance analytics is the process of collecting and interpreting program data — claims history, loss ratios, reserve levels, and product performance — to drive decisions about pricing, profitability, and program management. It's active financial oversight, not a year-end summary review.
What are the four types of analytics?
The four types are descriptive (what happened), diagnostic (why it happened), predictive (what will happen), and prescriptive (what action to take). All four apply to dealer-owned reinsurance — for example, predictive analytics can flag rising claims frequency before it erodes reserve levels.
What data should a dealer track in their reinsurance company?
The five core KPIs are loss ratio, claims frequency and severity by product, reserve adequacy (including IBNR), product penetration rates, and premium-to-distribution ratio. Together, these give a complete and actionable picture of program health.
How often should dealers review their reinsurance performance reports?
Monthly reviews are the minimum, with quarterly trend analysis and an annual strategic review. Monthly consistency allows dealers to catch reserve shortfalls or claims spikes early — rather than discovering them at year-end when the damage is already done.
Can small or newer dealers benefit from analytics in their reinsurance programs?
Smaller and newer programs benefit the most from early tracking. Building a clean historical record from day one creates the strongest foundation for reserve modeling, distribution planning, and long-term growth.